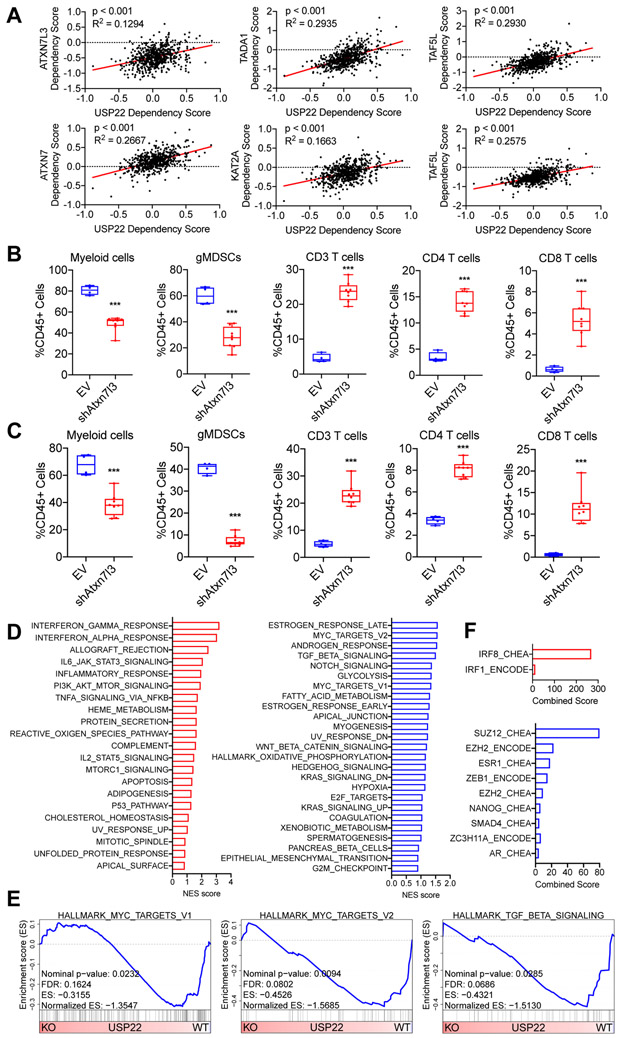
Figure 4. USP22 loss reprograms tumor cells towards a T cell–high transcriptional program.
(A) Dot plots showing the dependency scores for the indicated members of the SAGA/STAGA complex relative to USP22 across all tumor cell line samples in the Cancer Dependency Map. (B) Flow cytometric analysis of tumor-infiltrating immune cells in subcutaneously implanted 6419c5-EV– and 6419c5-Atxn7l3–knockdown tumors (2 independent knockdown cell lines, n=4-8 tumors analyzed per group in 1 experiment). (C) Flow cytometric analysis of tumor-infiltrating immune cells in subcutaneously implanted 6694c2-EV– and 6694c2-Atxn7l3–knockdown tumors (2 independent knockdown cell lines, n=4-8 tumors analyzed per group in 1 experiment). (D) Hallmark Gene Set Enrichment Analysis comparing differentially expressed genes in sorted Usp22-WT or Usp22-KO tumor cells (n=3-6 tumors analyzed per group). Gene sets enriched in Usp22-KO tumor cells are labeled in red (left); gene sets enriched in Usp22-WT tumor cells are labeled in blue (right). (E) Leading-edge plots from the GSEA analysis highlighting three Usp22-WT tumor cell-enriched gene sets: Hallmark_MYC_targets_V1, Hallmark_MYC_targets_V2, and Hallmark_TGF_beta_signaling. (F) Bar graphs showing predicted transcriptional regulators. Differentially expressed genes (p-adjusted<0.01 and absolute fold change >2) were used as input for EnrichR analysis (ENCODE and ChEA Consensus TFs from ChIP-X dataset). In (A), data are presented as dot plots with the red line showing the linear regression result. Correlation metrics are shown. In (B-C), data are presented as boxplots with horizontal lines and error bars indicating mean and range, respectively. Statistical differences between groups were calculated using Student’s unpaired t-test. *p<0.05, **p<0.01, ***p<0.001.

