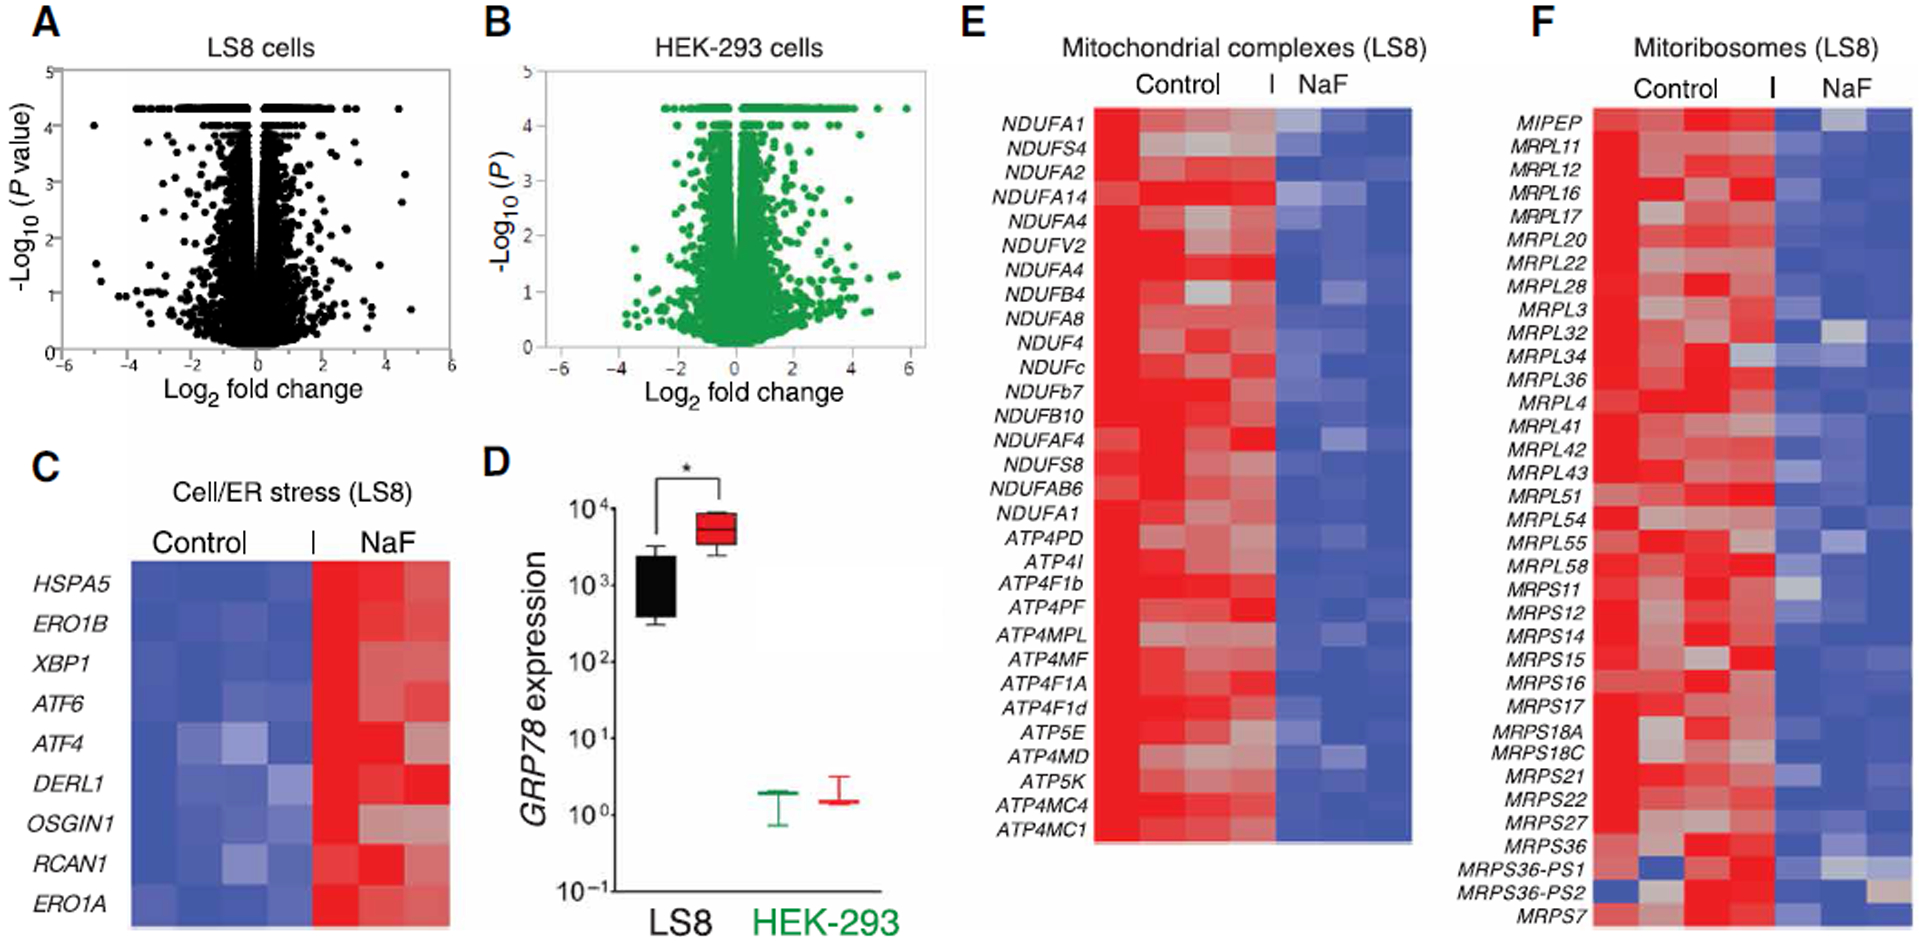
Fig. 3. RNASeq analyses of fluoride-treated LS8 and HEK-293 cells.

(A and B) Volcano plots of statistical significance (shown as the negative log base 10 of the P value on the y axis) compared to the magnitude of differential gene expression (shown as the log base 2 of magnitude of mean expression difference on the x axis) between control and NaF (1 mM) treatment for murine LS8 (A) and HEK-293 (B) cells. Data in (A) and (B) were obtained from four sets of untreated and three sets of NaF-treated cells. (C) Heat map of transcript abundance using one-way hierarchical clustering of untreated and 1 mM NaF–treated LS8 cells for 24 hours, showing the differential expression of genes encoding proteins associated with cell stress and UPR. Red indicates up-regulation. (D) RT-PCR showing the mRNA expression of the ER stress marker GRP78 in LS8 and HEK-293 cells in response to NaF (red boxes). Data represent the mean ± SEM of three independent experiments (*P < 0.05, ANOVA). (E) Differential expression of genes encoding proteins associated with the biosynthesis of mitochondrial complexes in LS8 cells. (F) Differential expression of genes encoding proteins associated with mitoribosome biosynthesis in HEK-293 cells. (E and F) Blue indicates down-regulation.
