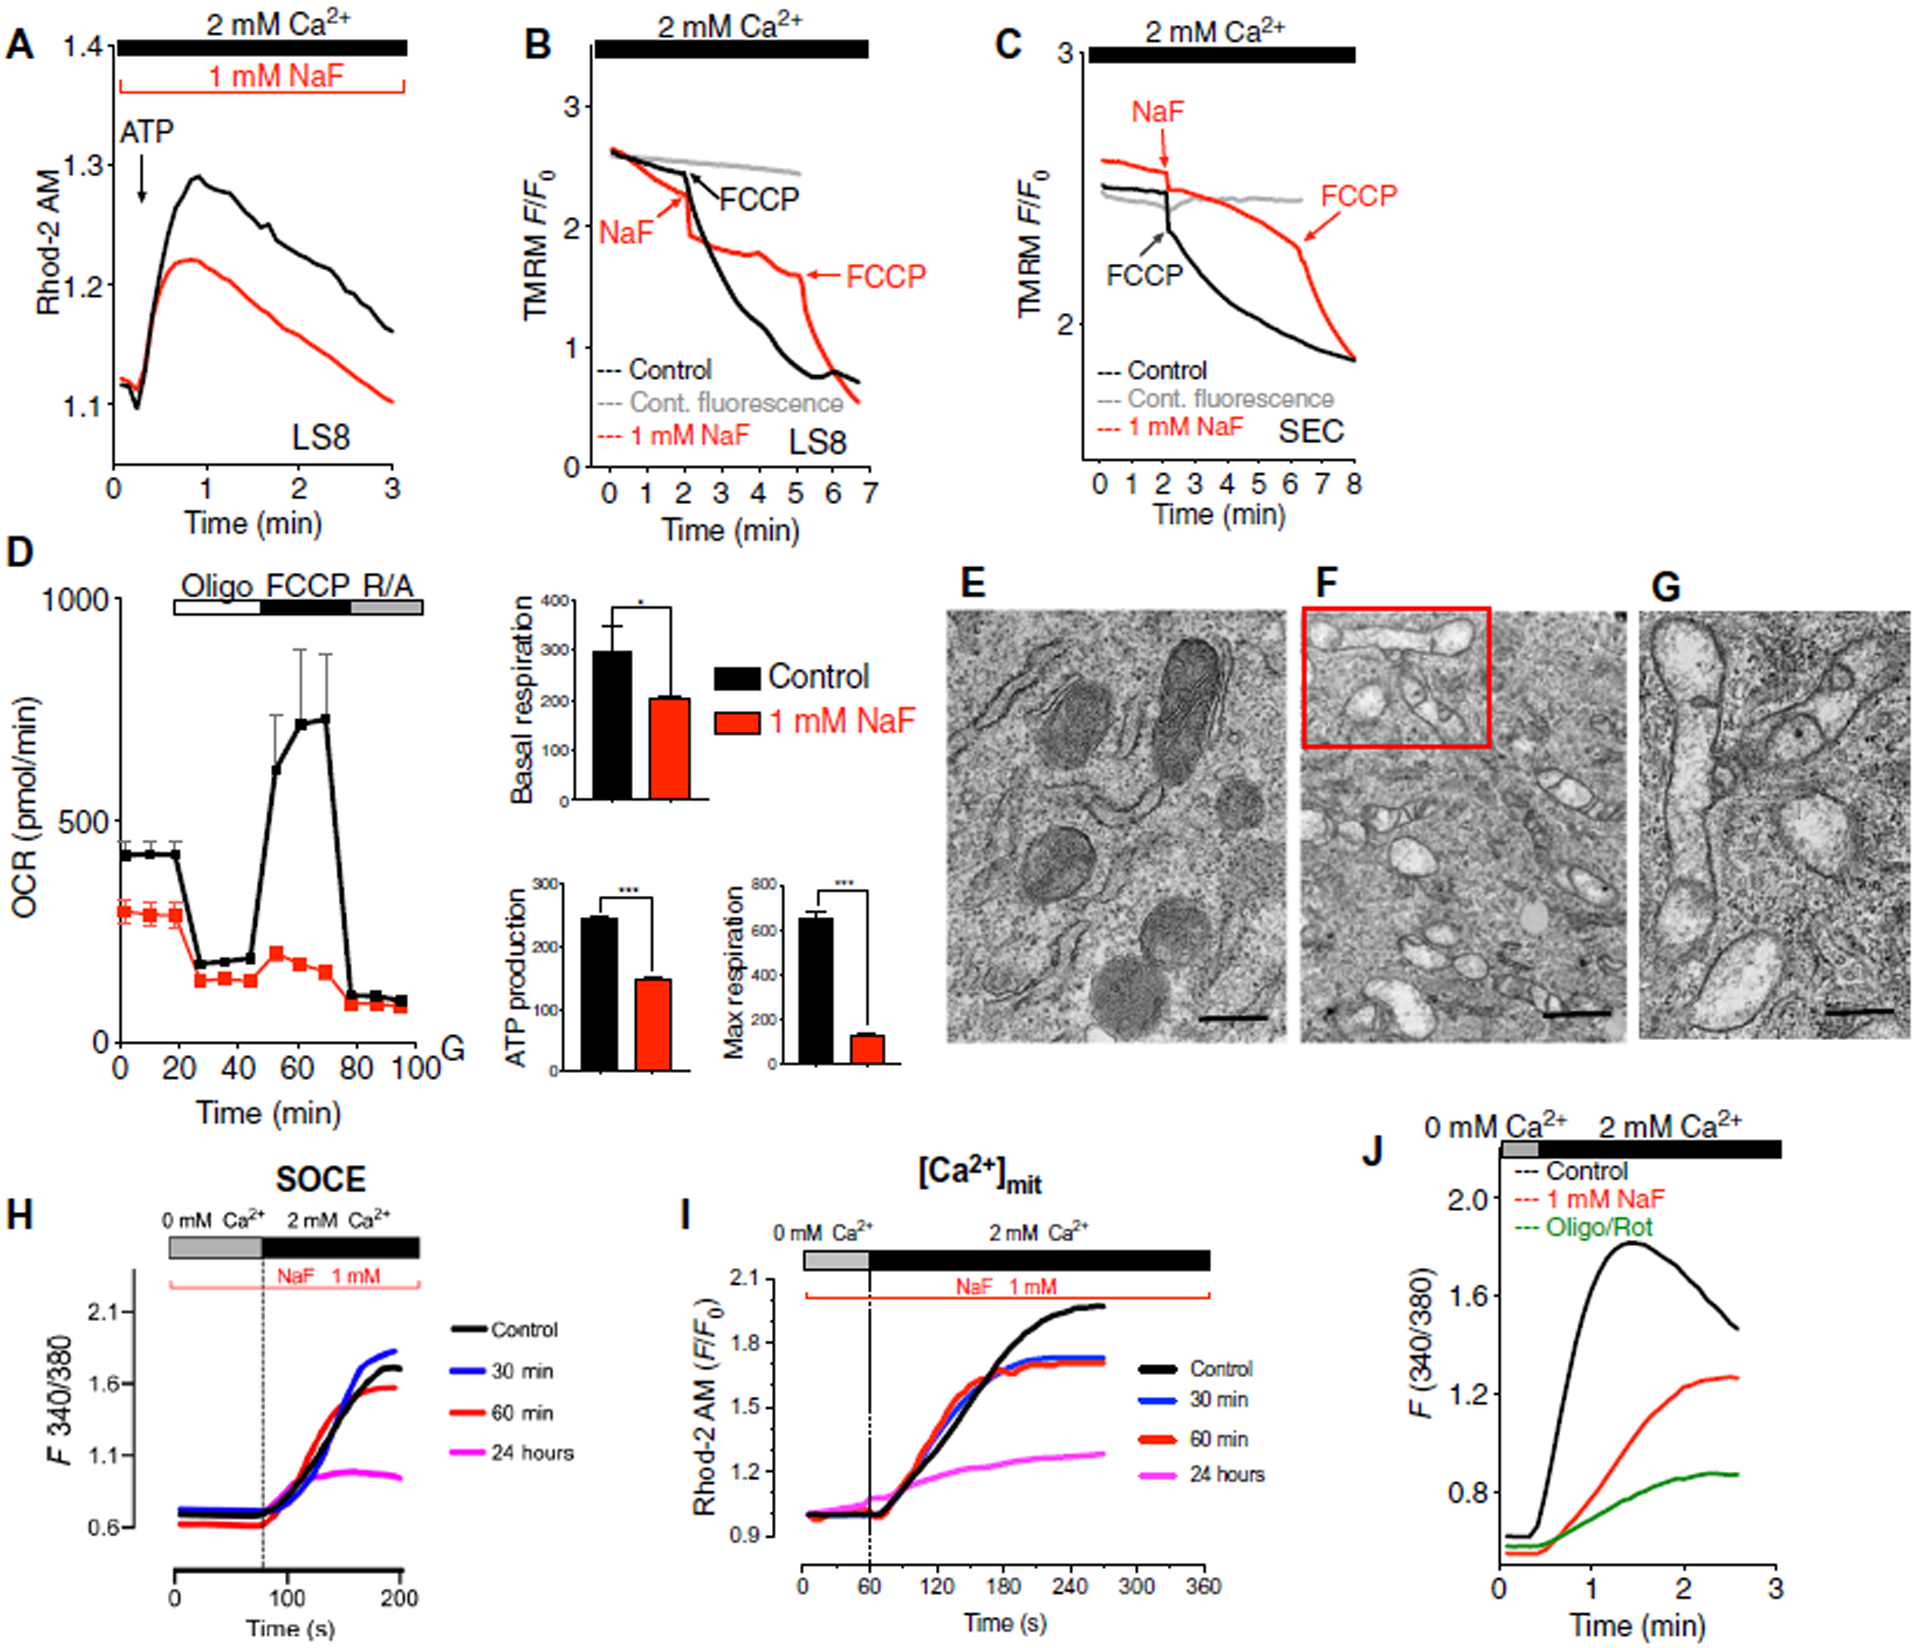
Fig. 5. Fluoride modified mitochondrial function and SOCE.

(A) Rhod-2–loaded control (untreated), LS8 (black trace), and fluoride-treated (24 hours) (red trace) cells transiently stimulated with ATP. Data represent the mean ± SEM of three independent experiments using Student’s t test (black compared to red: ****P < 0.0001). (B) Mitochondrial membrane potential measured in LS8 cells loaded with TMRM that were untreated and stimulated with FCCP (1.5 μM; black trace) or transiently stimulated with fluoride (1 mM) and FCCP (red trace). TMRM fluorescence was also monitored in cells not treated with FCCP (gray traces). Representative of 150, 100, and 120 cells. (C) Primary secretory cells analyzed as in (B). Representative of 90 untreated and stimulated with FCCP (black traces), 65 fluoride-and FCCP-treated cells (red traces), and 80 untreated cells (gray traces). (D) Oxygen consumption rate (OCR), basal respiration, ATP production, and maximal respiration in LS8 cells after 4 hours of NaF (1 mM) pretreatment. Data represent the mean ± SEM of three independent experiments using Student’s t test. (*P < 0.05 and ***P < 0.001). (E to G) Transmission electron micrographs of control LS8 cells (E) and fluoride-treated cells (F) (1 mM, 24 hours). Close-up of mitochondria (G) from (F) showing mitochondrial matrix with non–electron-dense matrix lacking cristae. Scale bars, 1 μm (E and F) and 0.5 μm (G). (H) SOCE measured after treating cells for 20 min with thapsigargin in untreated LS8 cells (black trace) or cells treated with NaF (1 mM) after 30 min, 60 min, and 24 hours. (I) [Ca2+] mit measured in Rhod-2–loaded LS8 cells after stimulation of SOCE as in (A). (J) SOCE measured after treating cells for 20 min with thapsigargin in untreated LS8 cells (black trace) or fluoride-treated (1 mM) cells (red trace) and cells treated with oligomycin (1 μM) and rotenone (2 μM) (green trace). Data in (H) to (J) represent the mean ± SEM of three independent experiments.
