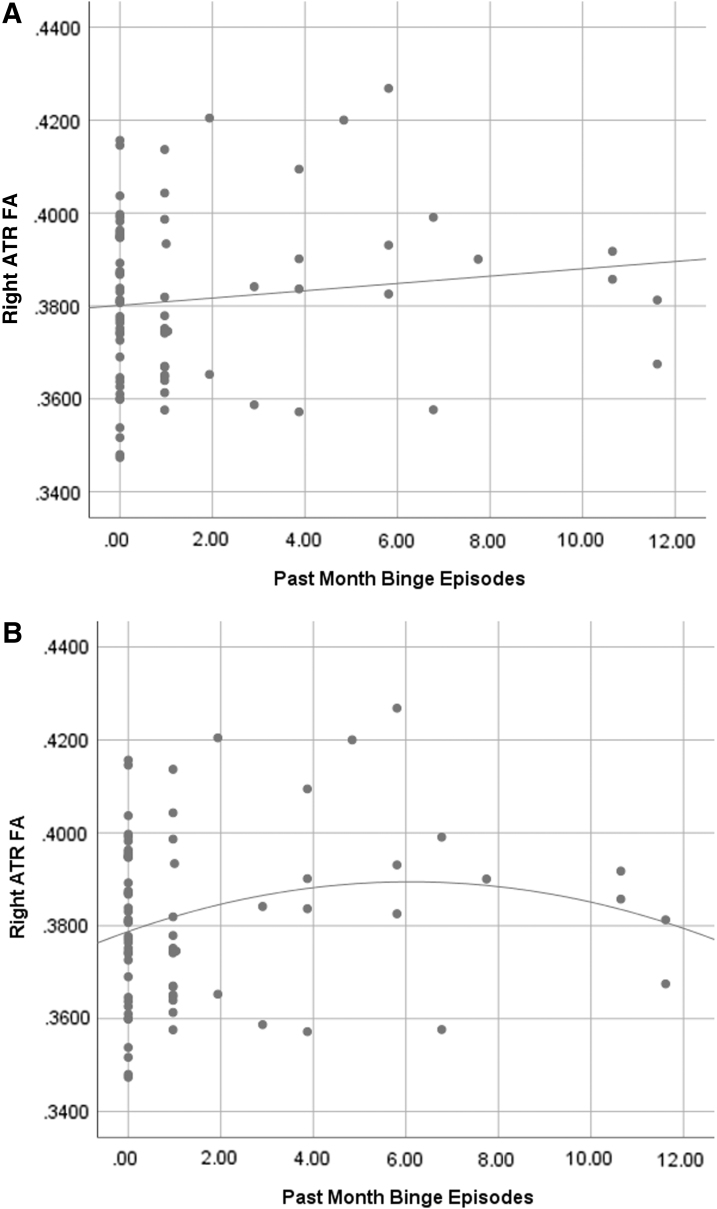
FIG. 1.
(A) Scatterplot of binge drinking episodes by right ATR FA values (R2=0.016) with linear fit line. (B) Scatterplot of binge drinking episodes by right ATR FA values (R2=0.039) with quadratic fit line. Both fit lines are presented to aid in interpretation, as the higher R2 value in the quadratic fit suggests there may be a nonlinear relationship between binge drinking and right ATR FA value. As the primary analyses used linear multiple regressions, it would be beneficial to assess nonlinear relationships in a future study. Note: Data were assessed for outliers, with no outliers revealed. ATR, anterior thalamic radiation; FA, fractional anisotropy.

