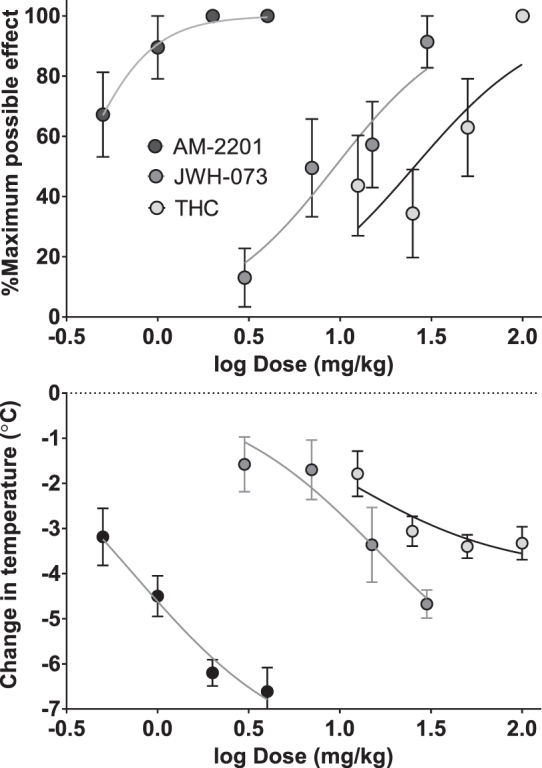
FIG. 2.

Dose–response curves showing antinociceptive (top) and hypothermic (bottom) effects produced by THC (n=8), JWH-073 (n=10), and AM-2201 (n=8) in male C57BL/6 mice. Data shown were calculated as described in methods and are the mean±SEM of each parameter for each treatment group. Data were fit by nonlinear regression analysis using Prism with %MPE and change in temperature bottom set to 0 and %MPE top (Emax) set to 100%. %MPE, % maximum possible effect.
