
Fig. 6.
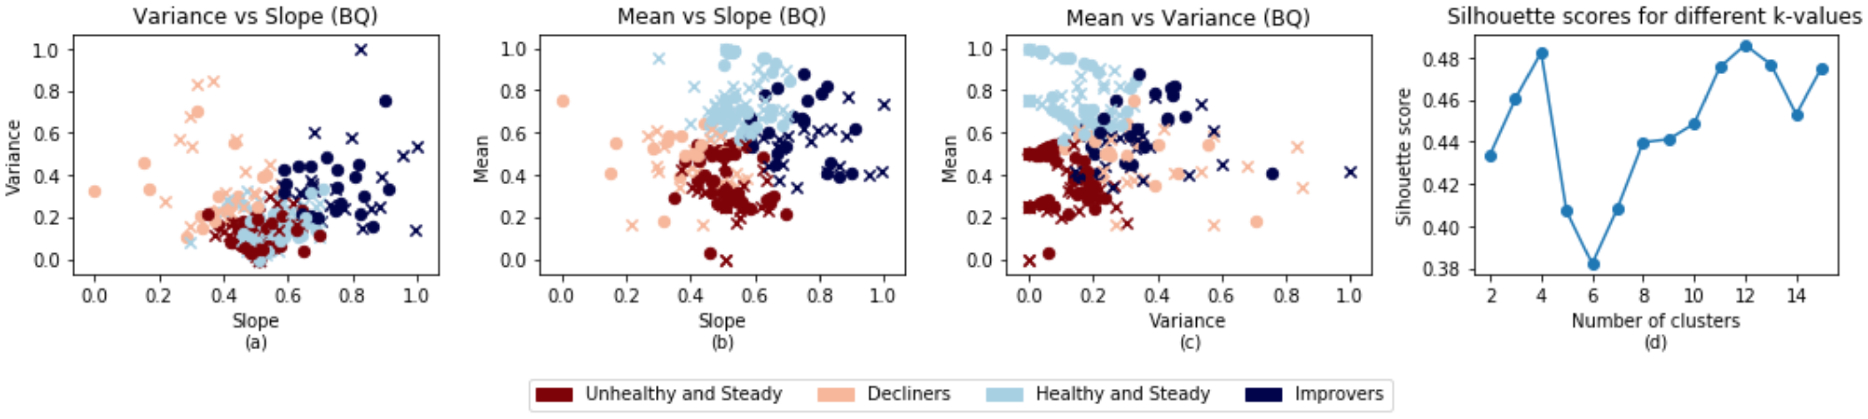
Clusters for the behavioral query response data obtained using the k-means algorithm. The circles indicate participants from the CVH group and crosses indicate participants from the WH group. a) Shows the general change in behavior over time (slope) vs the consistency (variance) of behavior over time. b) Shows the general change in behavior over time (slope) vs the overall amplitude (mean) of behaviors. c) Shows the consistency (variance) of behavior over time vs the overall amplitude (mean) of behavior. d) Silhouette plot showing the local optimal k value (k=4).