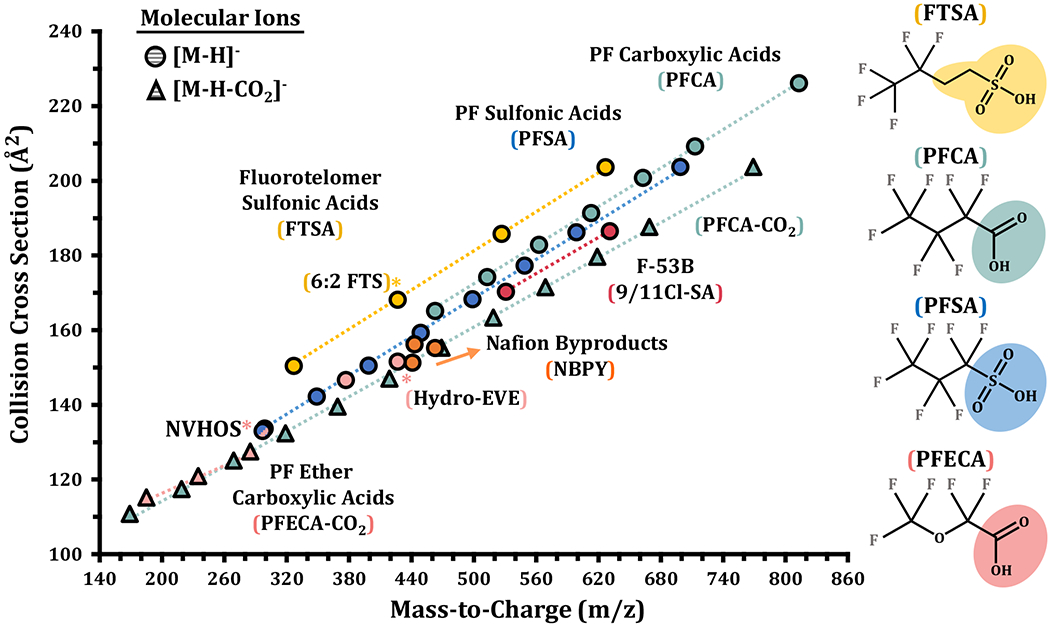
Figure 2.

Mass/CCS trendlines for the specific PFAS subclasses analyzed (e.g. FTSA, PFSA, etc.). Specific PFAS headgroups contribute significantly to the observed CCS for a given m/z in each PFAS subclass. The varying chain lengths of CF2 then produce the linear trendlines observed within each subclass. Specific compounds discussed in the main text (e.g. 6:2 FTS and Hydro-EVE) are noted in addition to the PFAS subclasses.
