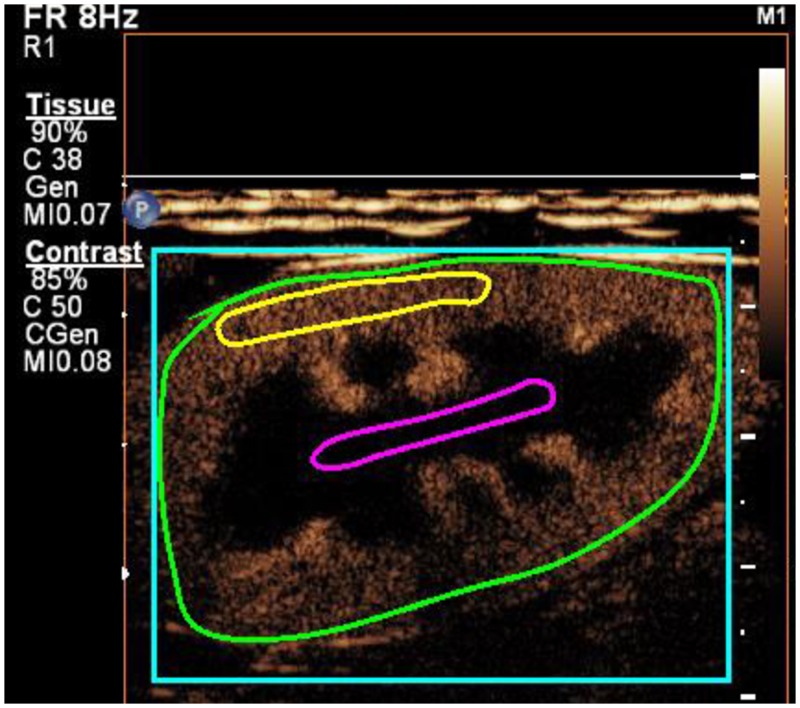
Fig 2. A contrast-enhanced ultrasound image of a left kidney in the sagittal plane of dog with region-of-interests drawn in the renal cortex (yellow line), renal medulla (magenta line) and on the entire kidney (green line).
The size of region-of-interests, from which time-intensity curves were generated, were 0.51 cm2 for the cortex and 0.37 cm2 for the medulla.

