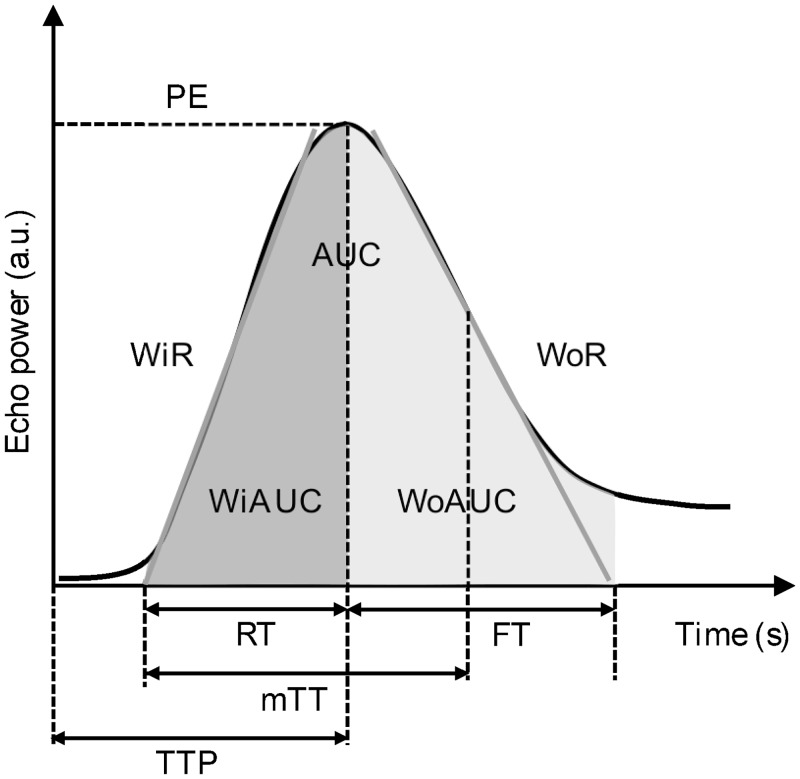
Fig 3. Schematic representation of a time intensity curve of the kidney.
The x-axis represents the time in seconds (s) and the y-axis represents the intensity in arbitrary units (a.u.). Intensity-related parameters are as follows: peak enhancement (PE) referring to maximum enhancement; wash-in area under the curve (WiAUC) and wash-out area under the curve (WoAUC) referring to the sum of all amplitudes inside the range from the beginning of the curve up to the time-to-peak (TTP) and from the TTP to the end of the descending curve, respectively; and total area under the curve (AUC)). Time-related parameters are as follows: rise time (RT) referring to the time interval between the first arrival of contrast and TTP; mean transit time (mTT) representing the mean duration of complete contrast perfusion, refers to the time when the tissue begins to enhance with contrast medium until the enhancement is half of the PE; TTP referring to the time of contrast agent injection to maximum enhancement; fall time (FT) referring to the duration of contrast wash-out) were determined from the time intensity curves. The slopes of the time-intensity curve are wash-in (WiR) and wash-out rate (WoR) referring to the maximum and minimum slopes, respectively. Wash-in perfusion index (WiPI) is calculated as WiAUC divided by RT. Adapted from the VueBox user manual with permission [33].

