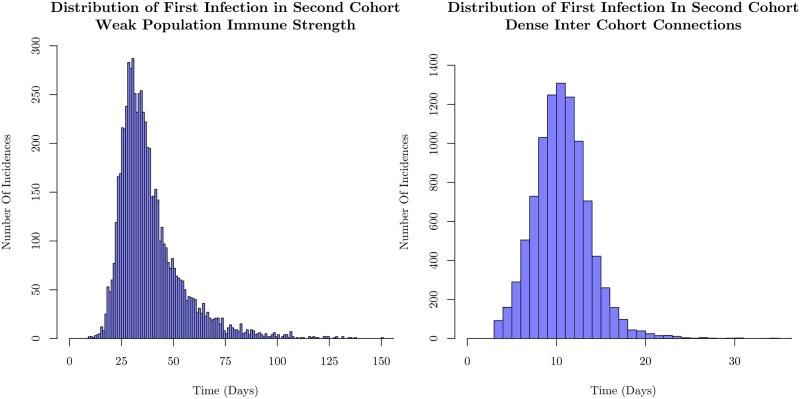
Fig 6. Distributions displaying the occurrence time of the first infection in the second cohort for weak immune strength.
The figure on the left is for cohorts in which 2% of the agents are connected to the second cohort on the left, and on the right is for cohorts in which 10% of the agents are connected to the second cohort. The intra-cohort structure remains unchanged, and the immune strengths of the two cases are the same. The sparsely connected structure displays a very wide distribution of first infection times, despite rapid intra-cohort spread as shown in Fig 5. We show that with more inter-cohort connections, the distribution is both shifted earlier in time, as well as substantially narrowed. This demonstrates that much of the stochasticity in the model is driven by the weak inter-cohort connections that are relatively few in number slowing the spread through the population as discussed in the text. The histograms each represent 10,000 sample simulations.

