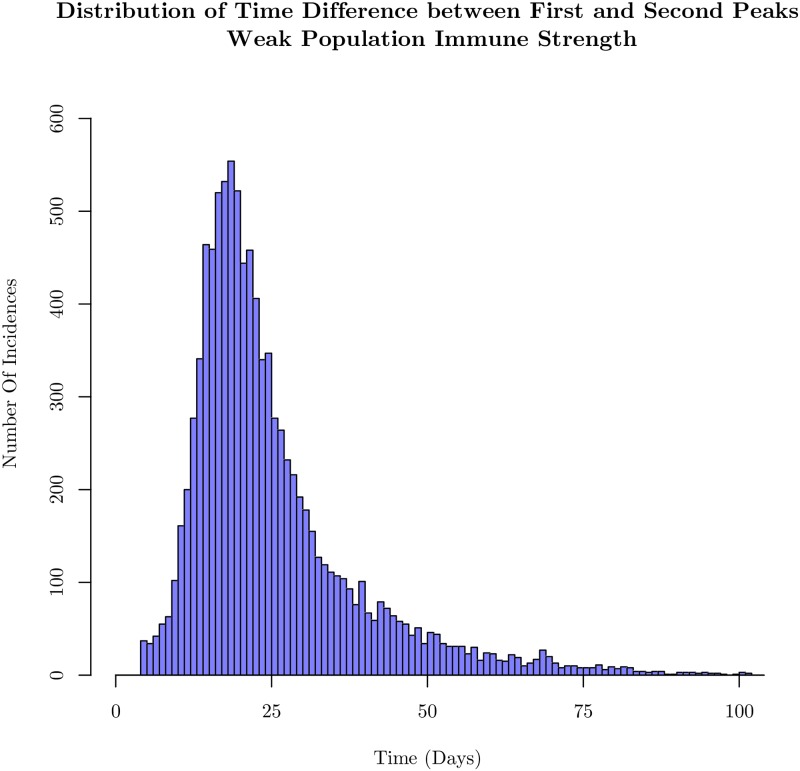
Fig 7. Histogram of the time between the first and second peaks in the time course of the number of infected (exposed and infectious) agents.
Analysis is done for the same parameters as used in Fig 3. With a weak collective immune strength, variability in the contact structure and individual immune strength causes wide fluctuations in the time course of infection events. The histogram is constructed out of 10,000 sample simulations.

