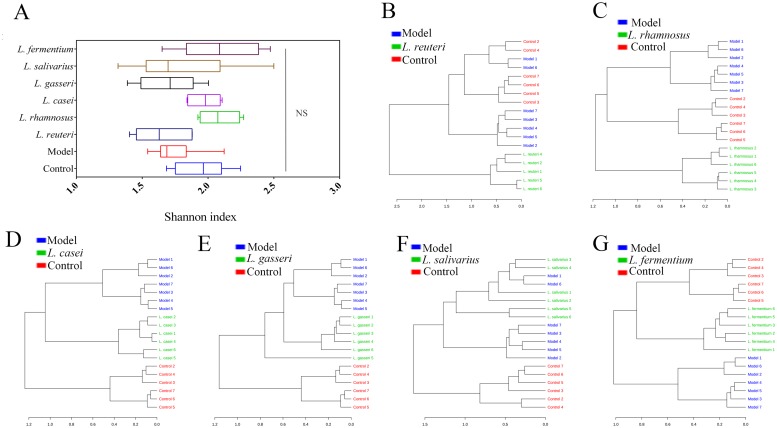
Fig 4. Taxonomic summary of gut microbiota in different mouse groups.
(A) Boxplot for α-diversity measured using Shannon index at genus level. (B–G) Dendograms showing the results of cluster analysis. Distance was measured using Bray-Curtis distance and clustering algorithm using Ward’s method at the OTU level.

