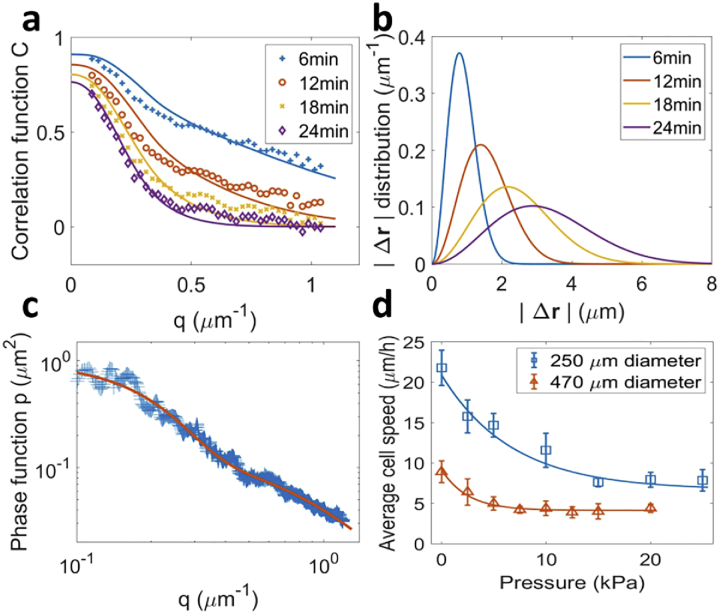
Fig. 4.
(a) Autocorrelation functions measured for a spheroid, with a delay going from to (markers). Data was fitted (lines) using Eqs. (4), 3 and 11. Fitting parameters are , , and . (b) Cell displacements magnitude distribution () multiplied by ) deduced from the fit of (a). (c) Phase function measured for a spheroid of 146 µm in diameter, averaged azimuthally. Data was fitted using Eqs. (4) and 8. (d) Mean cells speed inside spheroids as a function of the pressure applied, for spheroids of respectively and in diameter (markers). Data was fitted by an exponential decay (lines).

