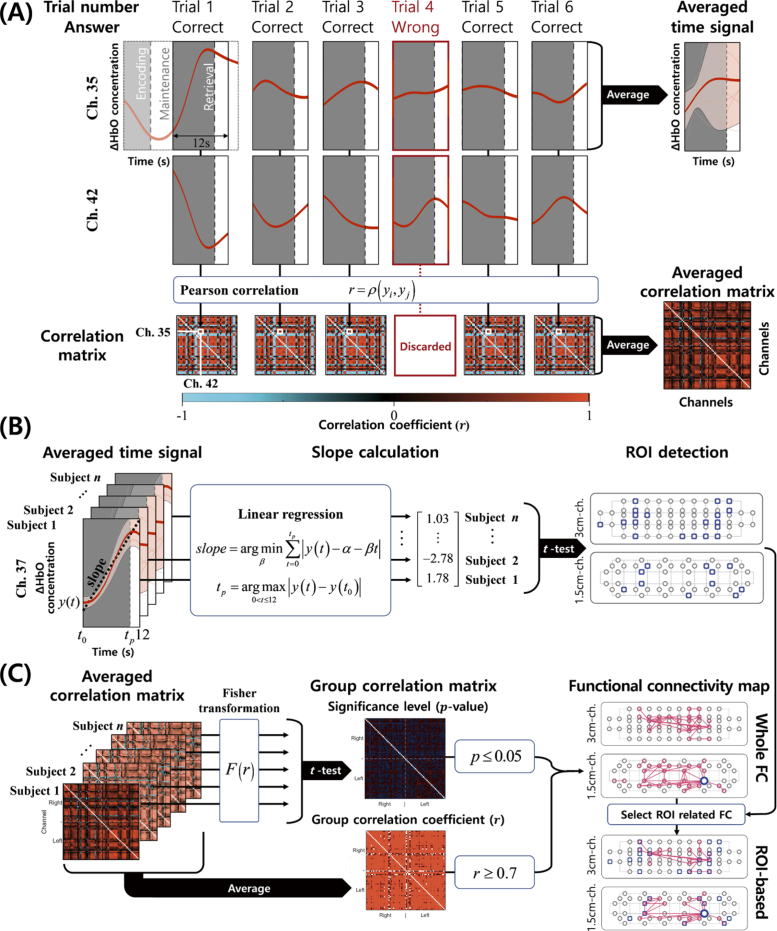
Fig. 3.
Explanation of data processing. (A) Averaged time-series signal and correlation matrix of the retrieval phase. (B) ROI detection by selecting channels with a statistically significant (p0.05) slope of the averaged time-series signal. The slope was calculated by linear regression in each participant, and a one-sample t-test was applied to assess statistical significance. (C) Derivation of FC map. Fisher transformation was applied to the averaged correlation matrix of each participant for the statistical significance level based on a t-test (p0.05). By averaging the correlation matrices of all participants, the group correlation coefficient with r 0.7 was calculated. Based on the significance level and group correlation coefficient, whole and ROI-based FC maps were derived.

