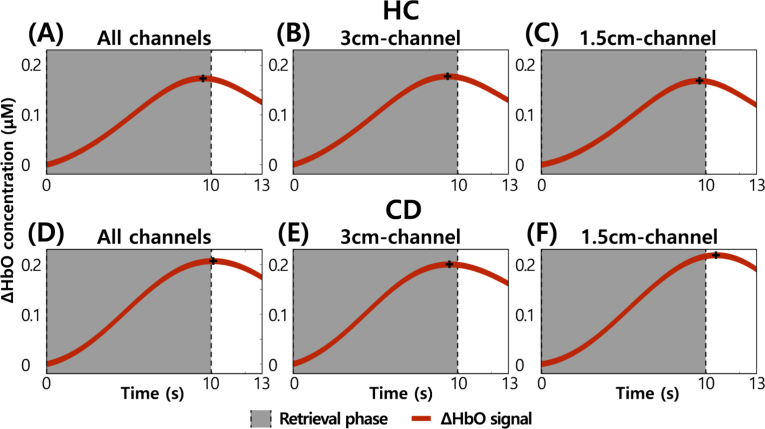
Fig. 5.
WM-related prefrontal hemodynamic signals averaged over trials, channels, and participants. (A) The signal averaged over all channels of the HC group. (B) The signal averaged over 3cm-channel of the HC group. (C) The signal averaged over 1.5cm-channel of the HC group. (D) The signal averaged over all channels of the CD group. (E) The signal averaged over 3cm-channel of the CD group. (F) The signal averaged over 1.5cm-channel of the CD group.

