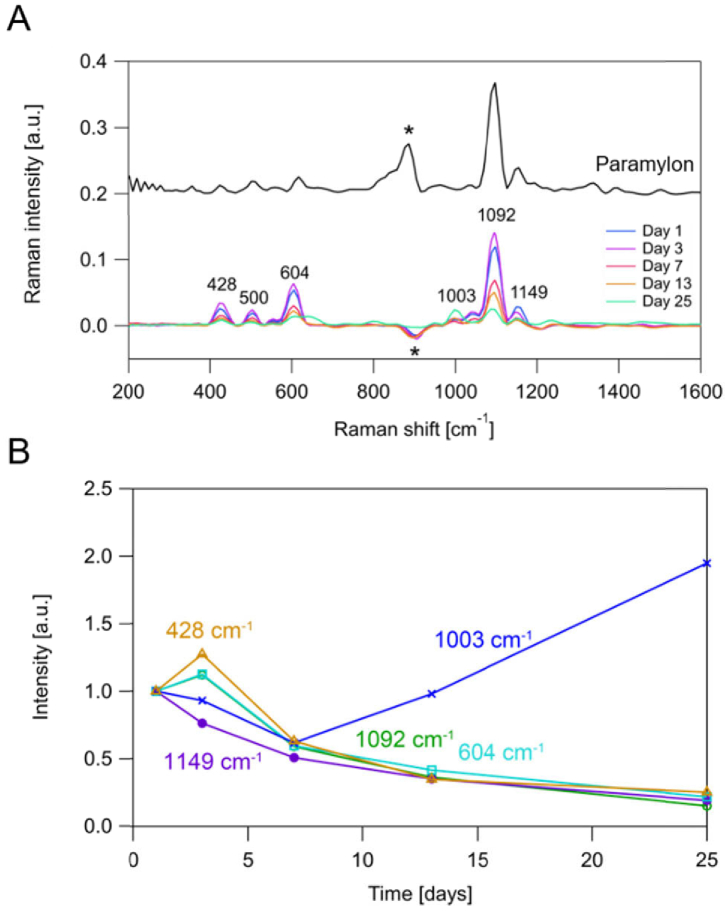
Fig. 2.
Time-dependent change of the averaged Raman spectral profiles (N = 10,000 for each condition). A: Raman spectrum of paramylon particles (top). Averaged Raman spectra of E. gracilis cells 1-25 days after the replacement of the culture (bottom). The asterisk (*) indicates the artificial peaks originating from the acoustic wave. B: Time-dependent changes of Raman intensities at 1092, 604 and 428 cm−1 (assignable to paramylon), 1149 cm−1 (unknown), and 1003 cm−1 (assignable to proteins).

