Abstract
We demonstrate large scale polarization contrast optical diffraction tomography (ODT). In cross-polarized sample arm detection configuration we determine, from the amplitude of the optical wavefield, a relative measure of the birefringence projection. In parallel-polarized sample arm detection configuration we image the conventional phase projection. For off-axis sample placement we observe for polarization contrast ODT, similar as for phase contrast ODT, a strongly reduced noise contribution. In the limit of small birefringence phase shift δ we demonstrate tomographic reconstruction of polarization contrast images into a full 3D image of an optically cleared zebrafish. The polarization contrast ODT reconstruction shows muscular zebrafish tissue, which cannot be visualized in conventional phase contrast ODT. Polarization contrast ODT images of the zebrafish show a much higher signal to noise ratio (SNR) than the corresponding phase contrast images, SNR=73 and SNR=15, respectively.
1. Introduction
3D imaging in the life sciences is of great importance for studying fundamental biology and performing (pre-) clinical studies. For these studies, label free optical imaging methods play an important role. There are various label-free contrast mechanisms such as scattering, absorption, or refractive index (RI). However, in some cases these contrast mechanisms are not sufficiently sensitive to observe the relevant information, hence, there is a need for imaging with alternative types of intrinsic contrast.
Optical diffraction tomography (ODT) has shown to be an effective tool for 3D imaging of RI contrast on the scale of cells [1] or small organisms [2]. More recently, phase contrast ODT was applied on a millimeter scale, where different structural features of a zebrafish larva and a cryo-injured heart could be distinguished in 3D using RI contrast [3]. However, some types of tissue are not visible in conventional phase contrast ODT.
An alternative form of contrast is given by the polarization change of the optical wavefield caused by tissue birefringence. Birefringent samples are not described by a single scalar RI value per voxel that contributes to the optical path length, but the RI value experienced by the wavefield depends on its polarization state. Polarization contrast has been widely applied in microscopy [4,5], digital holography [6], optical coherence tomography [7], and optical projection tomography [8]. Birefringence provides a high-constrast label-free mechanism for imaging fibrous structures such as muscle (collagen) or brain (myelin) tissue. Muscle tissue has been imaged in 3D using polarization sensitive optical projection tomography (OPT), as an extension of brightfield OPT using a white light source [8]. However, with OPT phase information is lost and refractive index contrast cannot be determined.
In this work we show that in addition to phase contrast also polarization contrast is compatible with large scale ODT and offers a significantly higher signal to noise ratio (SNR) compared to conventional phase contrast ODT. We determine under what conditions a birefringent sample can be properly reconstructed using conventional filtered backprojection (FBP). Furthermore, we show that off-axis sample placement, which has been used in conventional ODT [9] for noise reduction, also for polarization ODT offers significant noise reduction and that the same steps of numerical refocusing to correct for defocus can be applied. Finally, we demonstrate 3D multi-contrast imaging of a zebrafish larva using two orthogonal components of the transmitted wavefield, from which a conventional phase contrast and polarization contrast ODT image are reconstructed.
2. Polarization contrast imaging
In conventional ODT, refractive index differences in the sample cause a change in optical path length of the transmitted light wave. Assuming an isotropic medium, each voxel in the sample gives a fixed contribution to the optical path length of a ray traveling through it regardless of its’ polarization. However, when a sample is birefringent this contribution generally depends on the orientation of the polarization of the wave with respect to the medium.
Here we use Jones calculus to calculate light interactions. We assume that the birefringent tissue locally can be described as uniaxial, where the optical axis corresponds to the predominant fiber direction. The birefringent tissue is modeled as a wave retarder that introduces a relative phase shift along the fast axis with respect to the slow axis, and introduces a common phase shift (i.e. the average phase of the two components) for both polarization components. The relative phase shift between the two components is then defined as [10]
| (1) |
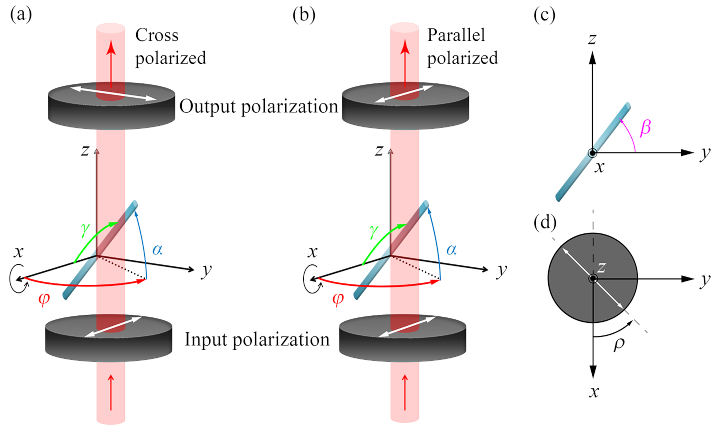
where is the fiber inclination angle relative to the - plane of the polarizers as indicated in Fig. 1(a-b). The wavenumber is given by and is the optical path difference integrated over the sample. As indicated in Fig. 1(a-b), the angle indicates the angle of rotation of the optic axis of the uni-axial sample with respect to the -axis projected onto the plane. The rotation angle of the polarizers is given by , which is the angle of the cross/parallel polarizers to the -axis. The birefringent object is assumed to rotate around the -axis for tomographic measurement with angle , which is shown in Fig. 1(c). We define the tilt angle of the object with respect to the axis as as show in Fig. 1(a-b). During tomographic measurements, the tilt angle stays constant. The tomographic rotation causes and to change for each projection according to
| (2) |
respectively.
Fig. 1.
Schematic of the ODT sample arm geometry. (a) The orientation of the uniaxial sample is defined by the inclination angle and the direction angle . The sample is rotated around the -axis for tomographic measurement. The input polarization state is along the -axis, after which the parallel polarized -component (a) or the cross-polarized -component (b) of the complex wave is measured for each projection angle. The tomographic angle is defined with respect to the fiber orientation in the - plane. The angle of the polarizers is defined with respect to the axis.
We assume an incoming beam polarized along the -axis that travels through the sample in the -direction. Both the and components are extracted by placing an analyzer in the sample arm that can be rotated to align with the parallel or cross-polarized -axis. The complex wavefield of an incoming wave polarized along the -axis after transmission through the birefringent medium is
| (3) |
with defined as the average phase
| (4) |
2.1. Parallel-polarization output
The first component in Eq. (3) is the -component of the transmitted field with a polarization parallel to that of the input field. It can be extracted by placing a polarizer aligned along the -axis after the sample. The -component in Eq. (3) contains phase contributions of both the conventional phase contrast and the birefringence contrast . The phase of this component is defined as the inverse tangent of the imaginary part divided by the real part
| (5) |
The derivative of with respect to is equal to unity and thus the measured phase of the -component is a linear function of the phase contrast projection . There is however also a contribution to the phase of the birefringence , which is in general non-linear. This can be seen by taking the derivative of Eq. (5) with respect to , i.e.,
| (6) |
where csc is the cosecant or the reciprocal of the sine function. For small values of , Eq. (5) can be expanded (in zeroth and first order) as
| (7) |
For small values of , the measured phase of the -component will thus be dominated by the average phase , where is the wrapped average phase.
2.2. Cross-polarization output
The vertical -component is the second component of the field in Eq. (3) and is perpendicular to the input polarization. The amplitude of this component is given by
| (8) |
Similar to what is done in polarimetry it can be measured using crossed polarizers. The presence of birefringence causes modulation in the amplitude of the wavefield as appears in the -component as in the amplitude. The amplitude modulation is utilized to generate qualitative birefringence contrast projections in 2D. However, this is problematic for 3D tomographic reconstruction as tomographic reconstruction algorithms usually assume a linear relation between contrast and projection. The projection function is thus not measured directly and must be retrieved. Taking the inverse sine of the modulation term we obtain
| (9) |
with and integer. In Eq. (9) the absolute value in the inverse sine is taken since the amplitude is the square root of the intensity and is thus always positive. The inverse sine changes the sign of the original function for values mod , making the inverse sine of the signal not directly suitable as a linear input projection for FBP reconstruction. Moreover, to reconstruct for arbitrary large , the signal needs to be unwrapped using phase unwrapping.
However, from Eq. (9) it follows that in case the maximum value of in the projection does not exceed , the signal can be directly retrieved by taking the inverse sine and no further processing is necessary. Even more, if is small, the amplitude of the -component of Eq. (3) can be approximated as a linear function of , since for small values of it holds that
| (10) |
To demonstrate the general approach of tomographic birefringence tomography a polarization contrast calculation for the case of a uniaxial birefringent cylinder of 10 mm radius with a maximum projected phase shift of radians is shown in Fig. 2. The blue line indicates the original phase shift as a function of position after a plane wavefront travels through the cylinder and this is the signal that has to be retrieved.
Fig. 2.
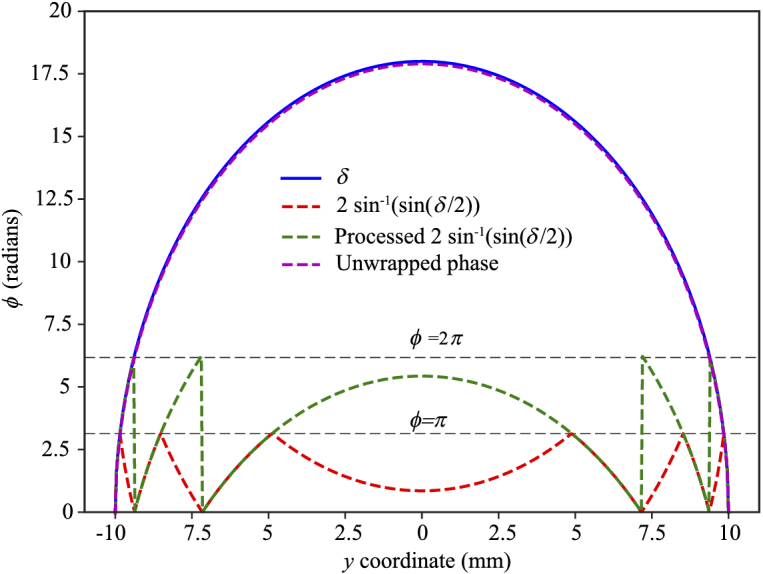
Phase shift between the two orthogonal polarizations in the case of a uniaxial birefringent cylinder with maximum projected phase shift radians as quantified with polarization contrast imaging.
The red line shows two times the inverse sine of the measured sin() term. The green line is obtained by flipping the inverse sine function in the appropriate domains and adding according to Eq. (9). The function can then be retrieved with standard phase unwrapping and is plotted in magenta and corresponds with the original birefringence distribution. Thus, in theory the projection function can be retrieved. However, in practice this may not be possible, for example, when the data is noisy or the jumps in the sinusoidal signal of the transmitted field are not properly sampled due to large increase of .
2.3. Polarization tomography
In 3D polarization sensitive tomographic imaging, the sample is rotated and the (parallel) and (cross) components of the wave are recorded for each angle for phase and polarization contrast respectively. Due to the small contribution of the birefringence contrast in the -component phase it can be used for conventional ODT. However, it should be noted that in order to preserve the linear relationship between the projection and the -component, it can be seen from Eq. (10) that not the intensity (amplitude squared) of the wavefield should be taken as the projection, but the square root of the intensity (amplitude).
However, in general itself depends on the tomographic rotation angle through in Eq. (1) and Eq. (2). Furthermore, the angle in Eq. (10) depends on as well through Eq. (2). Using these dependencies we find that for small the -component of the field is
| (11) |
Thus, even though the amplitude of is linear with respect to , the signal is non linear with respect to the rotation angle . The first non-linearity occurs due to the term in Eq. (11). In Appendix A we show that this term causes an angular modulation across the projections in the Radon transform, which translates to a slowly varying angular background modulation in the tomographic reconstruction, that leaves the object contrast intact. The second term in Eq. (11) modulates the amplitude as a function of the tomographic angle . This can be compensated for by taking the cross-polarization angle such that is maximum. Experimentally, this implies that tomographic image acquisition should be done for a sufficient number of cross-polarizer angles , and for each projection angle the maximum amplitude projection is subsequently selected [8]. Thus, despite the angular dependency of the phase shift , a linear reconstruction algorithm can be used for polarization contrast tomography.
The question arises whether the phase of the crossed-polarizer component can be used to do the conventional phase reconstruction, so that capturing of is not necessary. In cross polarization, the phase of the transmitted -component is defined for any path through the birefringent sample where the field amplitude is not zero. Hence, this component cannot be used to reconstruct the conventional RI contrast across the whole sample. However, the phase of the -component can be used in order to propagate the wavefield. This can be used to numerically refocus the wavefield if necessary, for example in the case of off-axis placement of the sample for noise suppression [3,9], or to extend the depth of field of the imaging system [2].
3. Materials and methods
3.1. Acquisition of projections
In ODT, the scattered field is recorded from multiple angles using digital holography. The digital holography setup is shown in Fig. 3 and consists of a Mach-Zehnder interferometer operated in transmission. The light source is a HeNe laser with a wavelength of 633 nm and an output power of 3 mW. Two lenses (Thorlabs, LD2568 and LA1979) are used to expand and collimate the illuminating laser beam to a full width at half maximum (FWHM) of approximately 15 mm.
Fig. 3.
Experimental setup for acquiring the digital holograms. HeNe: Helium Neon laser, BE: Beam expander, BS: Beam splitter, IML: Index matching liquid, S: Sample rotated around the z-axis, MO: Microscope objective, M: Mirror, TL: Tube lens, PZT: Mirror mounted on piezo stage, C: Camera, P: Polarizer, WP: Half-wave plate.
In the object arm a 10X objective lens (NA=0.3) is used in combination with a 200 mm focal length tube lens (Thorlabs) to image the sample in close proximity to the detector of a CMOS camera, (Basler beA4000-62kc) with pixels and a pixel pitch of 5.5 μm. A rotation mount (Thorlabs CR1) rotates the sample stepwise over . One polarizer is placed in front of the sample (P1), and a second one is placed behind the sample (P2). For acquisition of the regular phase contrast projections, the optical axes of the polarizers are made parallel and a acquisition of 720 projections over is performed. For the polarization contrast projections, the relative angle between both polarizers is kept constant at . The complete tomographic measurement is then carried out as before. The polarization contrast measurement is then repeated after simultaneous rotation of both the polarizers by and , respectively. In the reference arm, a polarizer (P3) is placed in order to maximize the fringe contrast at the detector; this polarizer is rotated simultaneously with the polarizers in the object arm. A half-wave plate is placed behind the beam expander in order to maximize the signal at the detector. In the reference arm, a 10X Olympus microscope objective partly compensates for the object wave curvature to avoid the presence of too high spatial frequencies on the camera. The mirror in the reference arm is mounted onto a piezoelectric transducer (Thorlabs, KPZ 101) controlled by a computer for phase-shifting the digital hologram. We capture four holograms with reference arm phase shift increments of between each subsequent hologram. From a linear combination of these holograms a complex hologram is formed where the zeroth and out of focus conjugate orders are removed [11]. In this way we maximize the lateral resolution in the reconstructed image. This is specifically important for large scale ODT where magnification is low but an as high as possible NA is desired.
3.2. Phase and polarization projections
Autofocus correction is applied on the digital hologram in order to obtain the wavefield in the object region. The object position is determined by calculating a focus metric (grayscale variance) as a function of the reconstruction distance. For transparent objects the gray scale variance has a minimum value when the reconstruction distance is located at the object. For polarization contrast projections, the gray scale variance has a maximum value when reconstructed in focus. For both cases separately the minimum/maximum is determined for ten samples of a full rotation acquisition (i.e. , , , etc.). A sinusoidal function is then fitted to the minimum/maximum as a function of the projection angle to determine the object distance as a function of projection angle. For every angle the hologram is reconstructed for both the phase and polarization contrast data, with the object in focus by propagating the field to the object plane using the angular spectrum method for diffraction calculation, which is exact and valid for small propagation distances. In case of the phase projections, the phase is then calculated by taking the argument of the reconstructed wavefield. The phase projections are unwrapped using a least squares phase unwrapping algorithm [12].
For the polarization contrast projections, the amplitude of the cross-polarized component is calculated. This amplitude then gives a direct, but scaled measure for the birefringence: scaled . For the different (cross) polarizations, the projections are misaligned horizontally by a few pixels. This is corrected by determining the center of rotation from the maximum variance of the tomographic reconstruction as a function of the shift for each polarization contrast sinogram individually. The projections are then shifted to the correct location using the circular shift function of MATLAB. The wavefield amplitude of the projections for the three angles are stacked, and the maximum value for each camera coordinate is extracted to form a single maximum birefringence projection sinogram. Tomographic imaging is performed with 720 projections over (steps of 0.) with four phase steps per projection. At every projection angle and phase step, four measurements are taken (one for phase, three for polarization contrast) in total. The net acquisition time for a full 3D measurement is approximately 7 minutes with the total acquired data around 160 GB.
3.3. Tomographic image reconstruction and visualization
For reconstruction of the phase contrast, assuming that RI variation in the sample is sufficiently small so that refraction does not occur, a phase projection is a scaled integral over the RI variation with respect to the background medium along the illumination direction. The average refractive index difference is calculated from the phase by using the system magnification and the pixel pitch [9]. Subsequently, the object is reconstructed using the FBP algorithm on a slice by slice basis. For polarization contrast, the maximum birefringence projection sinogram is reconstructed using the FBP algorithm as . We used the Drishti software package [13] to visualize and merge the phase and polarization contrast reconstructions with a non-linear transfer function.
3.4. Noise suppression in polarization sensitive ODT
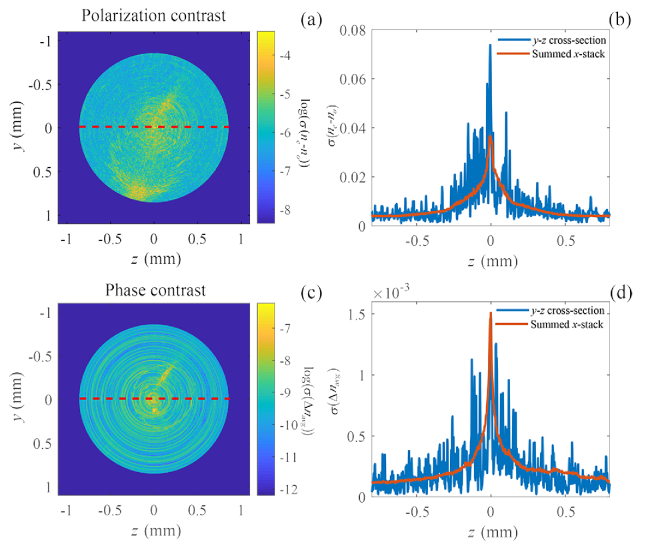
The sample is displaced from the center of rotation by approximately 0.5 mm. Figure 4 shows the noise distribution, in standard deviation , in a tomographic ODT reconstruction of both the polarization contrast (a) and (b) and the phase contrast (c) and (d). The polarization contrast ODT reconstruction suffers from increased noise in the region of the center of rotation, similar to what has been shown to be the case with phase contrast ODT. The noise at the center of rotation is approximately a factor 7 higher than outside of the center. This also shows that the on-axis noise reduction is even more significant in the case of polarization contrast ODT than in phase contrast ODT, where the noise reduction by off-axis placement was found to be in the order of a factor 2 for 720 projections [3].
Fig. 4.
(a) Logarithm of the standard deviation of a single polarization contrast reconstructed slice. (b) Cross-section along the dashed line in figure (a) and the average standard deviation over all slices of the stack (red). (c) Logarithm of the standard deviation of the phase contrast reconstructed slice. (d) Cross-section along the dashed line in figure (c) and the average standard deviation over all slices of the stack (red).
3.5. Zebrafish sample preparation
The sample is a 3 day old zebrafish embryo (wild type). The eggs are grown on a petridish and subsequently placed in PTU (1-phenyl 2-thiourea) to prevent pigment formation. At 72 hours, the eggs are dechorionated and fixated in 4% paraformaldehyde. Then, the eggs are washed with Phosphate buffered saline three times, after which it is replaced with 100% MeOH in two cycles for dehydration. The embryos are placed in small cylinders (4 mm diameter) and mixed with agarose (2% mass-percentage). After the agarose is dry, the agarose containing the embryo’s is removed from the cylinders and as a whole placed in BABB, a mixture of benzyl alcohol (Sigma B-1042) and benzyl benzoate (Sigma B-6630) in a 1:2 ratio, which makes the sample completely transparent [14]. During this process, the RI of the sample becomes almost that of the BABB clearing solution. We used a clearing time of 3 hours (similar to [3]) that ensures that the sample is transparent enough for optical phase tomography, while at the same time maximizing remaining RI contrast in order to keep a good signal (RI contrast in the reconstruction) to noise (background) ratio in the final reconstruction.
4. Results
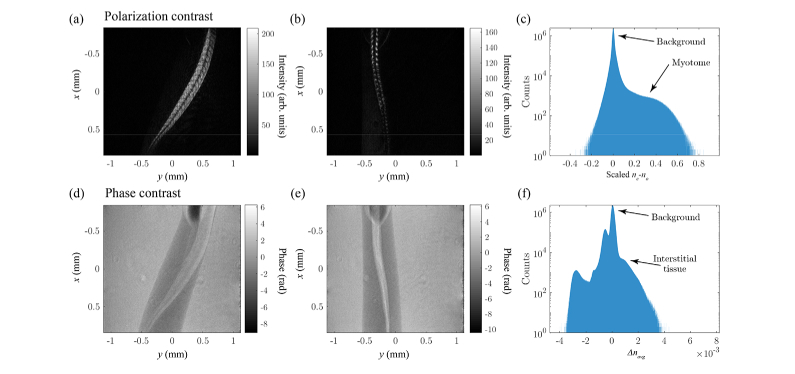
The polarization and phase contrast projections of a 3 day old zebrafish tail are shown in Fig. 5(a)-(b) and (d)-(e), respectively. The phase contrast projections are similar to our earlier work on ODT applied to zebrafish larvae [3]. In the polarization contrast projections most of the larva appears dark, due to the absence of birefringent tissue, except in the tail where the developing highly birefringent muscle tissue (myotome) is located. The polarization contrast results are found to be similar in comparison with 2D polarization contrast measurements of Jacoby et al. [15]. The histograms of the 3D polarization and phase contrast reconstructions are shown in Fig. 5(c) and (f) respectively. The polarization contrast histogram of the scaled birefringence shows two components, namely the background and the myotome tissue. In the phase contrast histogram of the polarization averaged refractive index multiple peaks, corresponding to different organs, are visible [3].
Fig. 5.
Reconstructed amplitude (a) and (b) and phase projections (d) and (e) from two different angles of a 3 day old optically cleared zebrafish larva, illustrating the different contrasts obtained through polarization and phase contrast respectively. In (c) and (f) the histograms of the full 3D data set are plotted for the polarization and phase contrasts, respectively. The background contribution is indicated in both histograms, and the myotome and interstitial tissue for the polarization and phase contrast respectively.
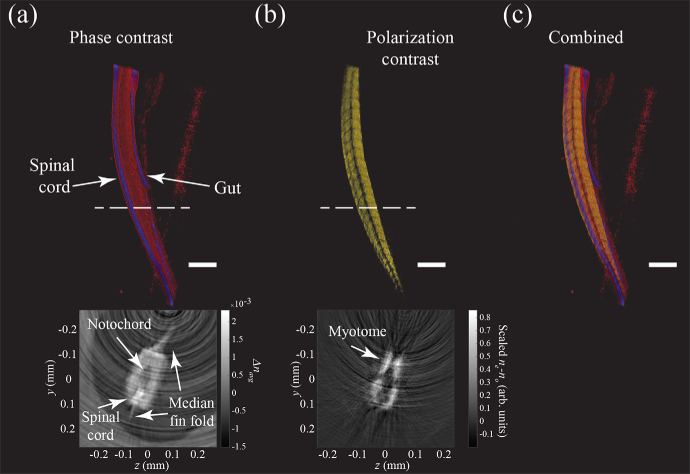
A 3D visualization of the phase contrast, the polarization contrast, the merged datasets and transverse cross-sections after tomographic reconstruction using FBP are shown in Fig. 6. It can be clearly seen from the visibility of the developing muscle tissue (myotome) that the phase and polarization contrast offer complementary contrasts, even though they spatially overlap. The anatomical structures are annotated based on reference data from microscopy [15] and OPT [16]. A striking result is the high contrast obtained in the polarization contrast projections compared to the phase projections. We quantify this by calculating the standard deviation of a background region outside of the center (since the level of noise is lower there), and estimate the mean of the signal in the tail at the same location for both the polarization and phase contrast reconstructions. For polarization contrast ODT, this yields an SNR of approximately SNR=, and for the phase contrast ODT we obtain an SNR of approximately SNR=. Polarization contrast ODT thus yields significantly higher SNR than phase contrast ODT for imaging the zebrafish tail.
Fig. 6.
3D visualization of the phase (a) and polarization (b) contrast, and combined (c) ODT reconstructions of a 3 day old zebrafish larva tail. In phase contrast, the tail (in red) and the spinal cord (in purple) appear, but not the developing muscle tissue (myotome), which is birefringent. In the polarization contrast reconstruction the structure of the myotome can be clearly discerned. Insets show transverse cross sections in linear intensity scale taken at the dashed line. Scalebar for 3D reconstruction corresponds to 200 µm.
5. Discussion and conclusion
We demonstrate 3D polarization contrast ODT, which has previously only been achieved only with OPT. Applying it within the framework of ODT makes it possible to image both phase and polarization contrast and make use of the benefits of ODT such as numerical refocusing and extended depth of field, due to the fact that both phase and amplitude of the polarization contrast field are measured.
5.1. Polarization ODT contrast
Coherent speckle causes increased noise levels close to the center of rotation in polarization contrast ODT similar as in conventional phase contrast ODT and the same strategy of off-axis placement and numerical refocusing can be applied to reduce the noise level up to a factor of 7. The polarization contrast ODT reconstruction yields a significantly higher signal to noise ratio compared to the phase contrast reconstruction. We attribute this to the fact that in phase contrast ODT the refractive index differences decrease during clearing, leading to a reduction of the signal to noise ratio in the reconstructed images. For polarization contrast ODT, the background is zero (no transmission in the absence of birefringence) and consequently leads to a relatively high contrast when birefringent tissue is present. Besides this qualitative argument, also quantitatively, the value of the average refractive index, which is proportional to , and the birefringence may vary during the clearing process [17] and thus influence the image contrast in both ODT modes.
5.2. Limit on maximum projected
Straightforward tomographic reconstruction only yields valid results for polarization contrast ODT in case is small. In phase projections of highly birefringent materials, such as a FEP (fluorinated ethylene propylene) tube, phase wrapping is clearly visible as a dense amplitude modulation. For cleared biological samples we have not observed dense amplitude modulation and, for all practical purposes, the wrapping problem is absent. Even for uncleared samples with 0.5 mm of birefringent tissue, phase wrapping is absent for birefringence lower than , which is still smaller than the typical birefringence of uncleared tissue [7].
For application outside of biomedicine, the wrapping of places a practical limitation on the amount of birefringence and/or the maximum sample thickness that can be imaged using conventional reconstruction. In principle, the correct projection and reconstruction can be retrieved in case the linearity requirement is violated using a modified unwrapping procedure based on the forward model. However, further research is needed for application of this procedure on experimental data.
5.3. Absolute quantification of birefringence
A limitation of the current method is that the polarization contrast is qualitative. Absolute quantification of the birefringence is challenging as the magnitude of the signal is dependent on the incident field distribution, sample optical absorption, the light to electron conversion, and the fiber orientation. In principle the first three factors can be divided out using a reference measurement, e.g., from the amplitude of the parallel polarization state projection.
A further complication comes from the tomographic angle dependence of that causes a modulation outside of a continuous region of birefringence. In case the macroscopic assumption of uniform birefringence across a region does not apply, but the fiber orientation changes significantly on small length scales this may cause reconstruction artifacts. The case for quantitative birefringence tomography (quantification of optic axis, , and ) is more complicated as it requires more information per projection angle and a non-linear inversion scheme. This is outside of the scope of the current work.
5.4. Applicability of the uniaxial model
The analysis and simulations in this paper are based on the assumption of uniaxial birefringence. The uniaxial model is a simple and widely used model in polarization microscopy, and applicable to fibrous structures such as myelin, elastin, and collagen. The well-defined fiber orientation as is present in the uniaxial model would be of importance to extract from the data. Further research is needed to determine whether fiber orientation can be retrieved in 3D, for example by performing more measurements under different input polarizations and using a full vectorial reconstruction [18].
Although the uniaxial model works for a large class of tissues, some types of tissues exhibit biaxial birefringence [19]. In addition, in some voxels there may be overlapping tissue fibers. Incorporating this in the tomographic reconstruction requires a more elaborate birefringence model.
5.5. Conclusion
We demonstrated 3D polarization contrast ODT. The developing muscle tissue in the tail of the zebrafish larva is known to be birefringent and cannot be discerned in conventional phase contrast ODT reconstruction. By illuminating the sample with a single polarization input state and measuring both the parallel (for the phase) and the orthogonal component (for the polarization contrast) with digital holography a conventional and polarization contrast ODT reconstruction of the same object can be obtained.
Acknowledgements
We would like to thank Sonja Chocron and Jeroen Bakkers from the Hubrecht Institute for providing zebrafish larvae. We thank Dr. Miriam Menzel for useful discussions.
A. Appendix
Here we demonstrate the effect of the angular dependency in the amplitude projection on the tomographic reconstruction. The object we consider is a cylinder according to the orientation outlined in the theory section of this paper. The cylinder has radius , and birefringence . For a plane wave traveling along the -axis linearly polarized along the -axis, the polarization contrast is retrieved from the cross-polarized transmitted component after traveling through the sample. This component is given by the component of Eq. (A2). Using the relations , and , the full expression for on becomes
| (A1) |
and the amplitude of is
| (A2) |
For a cylinder located at the origin with a tilt with respect to the -axis of tomographic rotation, the cross-section seen by a wave traveling along the -axis is an ellipse , with semi-major and semi-minor axes and , respectively. The Radon transform for a 2D slice of the ellipse gives the path length experienced by the probing wave per projection angle and is given by [20]
| (A3) |
where
| (A4) |
and is the transverse coordinate along the projection. Replacing in Eq. (A2) with , the effective amplitude projection function measured at the detector becomes
| (A5) |
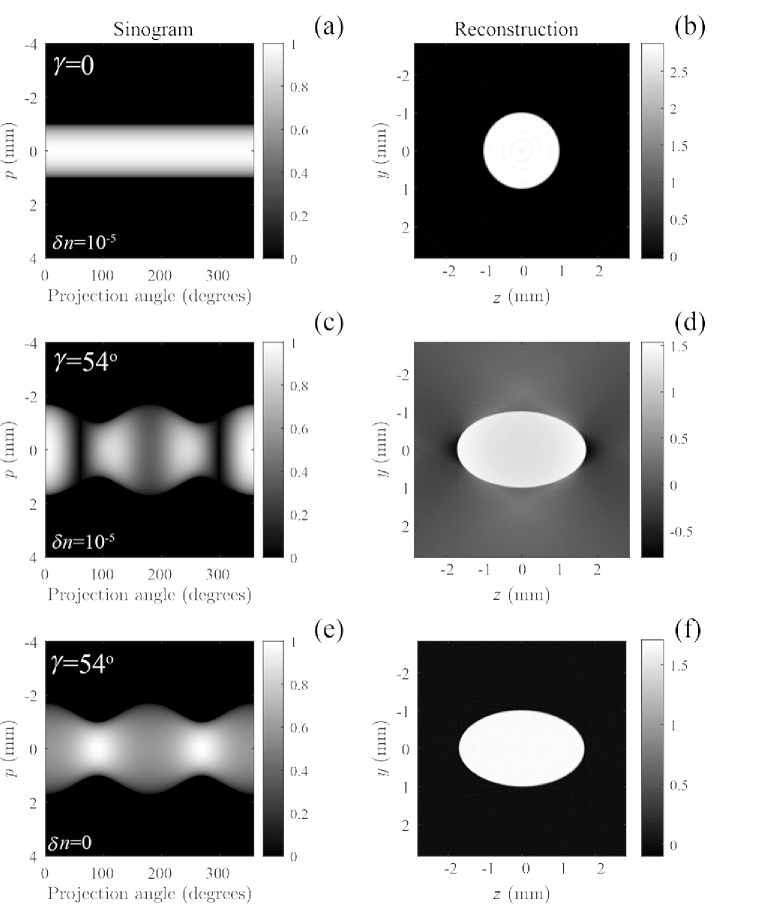
The projection functions along with the resulting tomographic reconstructions are plotted in Fig. 7 for tilt angles (a-b) and (c-d). The simulation parameters are cross-polarizer angle , , mm and . For comparison, the case for a non-birefringent cylinder at is shown (e-f). It can be seen that the angular dependency of the amplitude projections results in a modulation along the horizontal projection angle axis in Fig. 7(c). Since this does not cause modulation along the transverse coordinate axis and the amplitude is zero outside of the projection of the birefringent object, the contrast inside the birefringent sample is not modulated (Fig. 7(d)). Instead, it gives a slowly varying angular modulation in the background.
Fig. 7.
Plot of the projection functions along with the resulting tomographic reconstructions for tilt angles (a-b) and (c-d). The simulation parameters are cross-polarizer angle , , mm and . For comparison, the case for for a non-birefringent cylinder is shown (e-f).
Disclosures
The authors declare that there are no conflicts of interest related to this article.
References
- 1.Kim K., Kim K. S., Park H., Ye J. C., Park Y., “Real-time visualization of 3-D dynamic microscopic objects using optical diffraction tomography,” Opt. Express 21(26), 32269 (2013). 10.1364/OE.21.032269 [DOI] [PubMed] [Google Scholar]
- 2.Choi W., Fang-Yen C., Badizadegan K., Dasari R. R., Feld M. S., “Extended depth of focus in tomographic phase microscopy using a propagation algorithm,” Opt. Lett. 33(2), 171 (2008). 10.1364/OL.33.000171 [DOI] [PMC free article] [PubMed] [Google Scholar]
- 3.van Rooij J., Kalkman J., “Large-scale high-sensitivity optical diffraction tomography of zebrafish,” Biomed. Opt. Express 10(4), 1782 (2019). 10.1364/BOE.10.001782 [DOI] [PMC free article] [PubMed] [Google Scholar]
- 4.Oldenbourg R., “A new view on polarization microscopy,” Nature 381(6585), 811–812 (1996). 10.1038/381811a0 [DOI] [PubMed] [Google Scholar]
- 5.Massoumia F., Juškaitis R., Neil M. A. A., Wilson T., “Quantitative polarized light microscopy,” J. Microsc. 209(1), 13–22 (2003). 10.1046/j.1365-2818.2003.01095.x [DOI] [PubMed] [Google Scholar]
- 6.Wang Z., Millet L. J., Gillette M. U., Popescu G., “Jones phase microscopy of transparent and anisotropic samples,” Opt. Lett. 33(11), 1270 (2008). 10.1364/OL.33.001270 [DOI] [PubMed] [Google Scholar]
- 7.Everett M. J., Schoenenberger K., Colston B. W., Silva L. B. D., “Birefringence characterization of biological tissue by use of optical coherence tomography,” Opt. Lett. 23(3), 228 (1998). 10.1364/OL.23.000228 [DOI] [PubMed] [Google Scholar]
- 8.Fang M., Dong D., Zeng C., Liang X., Yang X., Arranz A., Ripoll J., Hui H., Tian J., “Polarization-sensitive optical projection tomography for muscle fiber imaging,” Sci. Rep. 6(1), 19241 (2016). 10.1038/srep19241 [DOI] [PMC free article] [PubMed] [Google Scholar]
- 9.Kostencka J., Kozacki T., Dudek M., Kujawińska M., “Noise suppressed optical diffraction tomography with autofocus correction,” Opt. Express 22(5), 5731–5745 (2014). 10.1364/OE.22.005731 [DOI] [PubMed] [Google Scholar]
- 10.Menzel M., Michielsen K., Raedt H. D., Reckfort J., Amunts K., Axer M., “A Jones matrix formalism for simulating three-dimensional polarized light imaging of brain tissue,” J. R. Soc., Interface 12(111), 20150734 (2015). 10.1098/rsif.2015.0734 [DOI] [PMC free article] [PubMed] [Google Scholar]
- 11.Yamaguchi I., Zhang T., “Phase-shifting digital holography,” Opt. Lett. 22(16), 1268 (1997). 10.1364/OL.22.001268 [DOI] [PubMed] [Google Scholar]
- 12.Ghiglia D. C., Romero L. A., “Robust two-dimensional weighted and unweighted phase unwrapping that uses fast transforms and iterative methods,” J. Opt. Soc. Am. A 11(1), 107 (1994). 10.1364/JOSAA.11.000107 [DOI] [Google Scholar]
- 13.Limaye A., “Drishti: a volume exploration and presentation tool,” Proc. SPIE 8506, 85060X (2012). 10.1117/12.935640 [DOI] [Google Scholar]
- 14.d’Esposito A., Nikitichev D., Desjardins A., Walker-Samuel S., Lythgoea M. F., “Quantification of light attenuation in optically cleared mouse brains,” J. Biomed. Opt. 20(8), 080503 (2015). 10.1117/1.JBO.20.8.080503 [DOI] [PMC free article] [PubMed] [Google Scholar]
- 15.Jacoby A. S., Busch-Nentwich E., Bryson-Richardson R. J., Hall T. E., Berger J., Berger S., Sonntag C., Sachs C., Geisler R., Stemple D. L., Currie P. D., “The zebrafish dystrophic mutant softy maintains muscle fibre viability despite basement membrane rupture and muscle detachment,” Development 136(19), 3367–3376 (2009). 10.1242/dev.034561 [DOI] [PMC free article] [PubMed] [Google Scholar]
- 16.Bryson-Richardson R. J., Berger S., Schilling T. F., Hall T. E., Cole N. J., Gibson A. J., Sharpe J., Currie P. D., “Fishnet: an online database of zebrafish anatomy,” BMC Biol. 5(1), 34 (2007). 10.1186/1741-7007-5-34 [DOI] [PMC free article] [PubMed] [Google Scholar]
- 17.Chen D., Zeng N., Xie Q., He H., Tuchin V. V., Ma H., “Mueller matrix polarimetry for characterizing microstructural variation of nude mouse skin during tissue optical clearing,” Biomed. Opt. Express 8(8), 3559 (2017). 10.1364/BOE.8.003559 [DOI] [PMC free article] [PubMed] [Google Scholar]
- 18.Lauer V., “New approach to optical diffraction tomography yielding a vector equation of diffraction tomography and a novel tomographic microscope,” J. Microsc. 205(2), 165–176 (2002). 10.1046/j.0022-2720.2001.00980.x [DOI] [PubMed] [Google Scholar]
- 19.Ravanfar M., Yao G., “Measurement of biaxial optical birefringence in articular cartilage,” Appl. Opt. 58(8), 2021 (2019). 10.1364/AO.58.002021 [DOI] [PubMed] [Google Scholar]
- 20.Kak A. C., Slaney M., Principles of Computerized Tomographic Imaging (IEEE Press, 2001).


