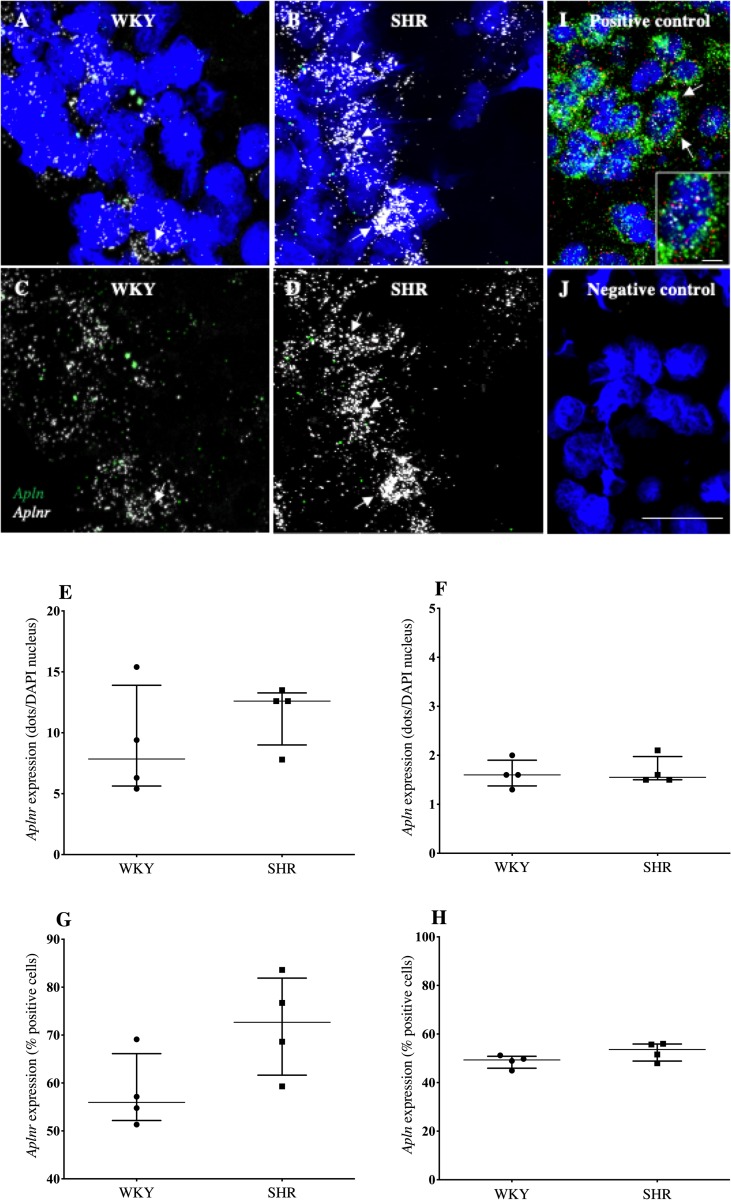
Fig 1. Aplnr and apln expression in the OVLT of WKY rats and SHRs.
(A-D) Representative fluorescent images showing expression of aplnr and apln in the OVLT of WKY rats (A and C) and SHRs (B and D). DAPI: blue, aplnr: white, apln: green. DAPI removed from C and D to highlight distribution of mRNA. Arrows point to representative cells with relatively high levels of aplnr expression. (E-H) Graphs showing gene expression as a function of dots/DAPI nuclei or percentage positive cells for aplnr (E and F) and apln (G and H) expression. n = 4/group. Data is median [IQR]. Sections were also analysed with positive (rat polymerase (RNA) II (DNA directed) polypeptide A, transcript variant 1 (POLR2A;white dots), peptidylprolyl isomerase (PPIB; red dots) and ubiquitin C (UBC; green dots)) (I) and negative (DapB (of Bacillus subtilis strain)) (J) with nuclei counterstained with DAPI (blue). The inset shows a high magnification image of the cell depicted by white arrows. Scale bar = 50μm and 10μm for the inset image.

