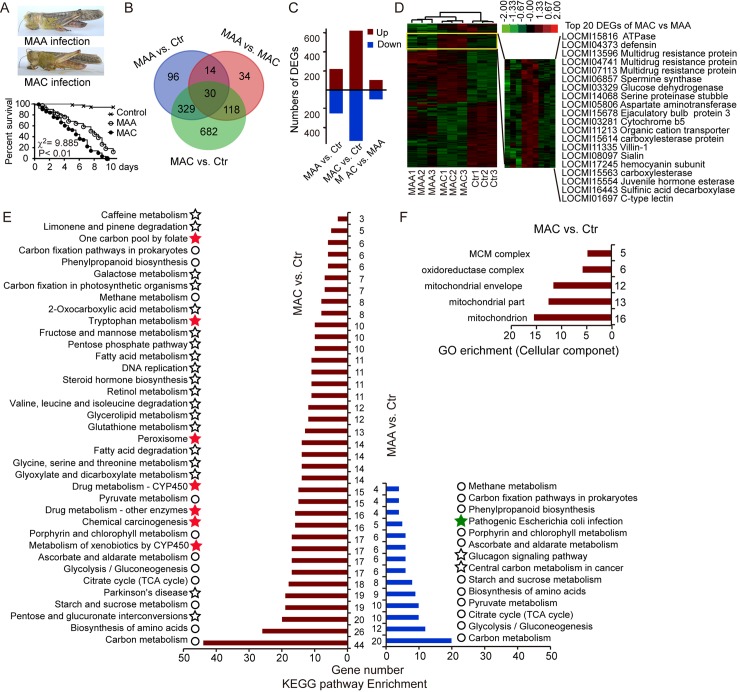
Fig 1. Generalist MAA and specialist MAC fungus induced different responsiveness of locusts.
(A) Mycosis and survival of locusts after infection by MAA and MAC. Adult male locusts were used in the bioassay and estimation of LT50 values. A significant difference was observed between the locusts infected by these two fungal species after Kaplan–Meier analysis (ncontrol = 49, nMAA = 50, nMAC = 50, P < 0.01). (B) Venn diagram results showing differentially expressed genes in fat body samples infected by MAA and MAC after transcriptome analysis of locusts’ fat body samples. (C) Transcriptome analysis showing the number of differentially up- and downregulated genes of each treatment for comparison. (D) Heat map of differentially expressed genes in locusts showing the distinct pattern of MAA and MAC infection. The right panel shows the genes of locusts distinctively induced by MAC infection. The colored bar indicates the normalized gene expression by z-score transformation.(E) After the enrichment of differentially expressed genes, MAA uniquely induced three pathways of infected locusts (labeled as star figure, green color indicates the immune response), whereas MAC uniquely induced 26 unique pathways of infected locusts (labeled as star, red star indicates the detoxification pathways, including xenobiotic response and potential toxics catabolism; circles indicate the pathways in fat body cells of locusts induced by either MAA or MAC infection). (F) GO enrichment showing the unique class (cell component), including mitochondrial part and oxidoreductase induced by MAC infection.

