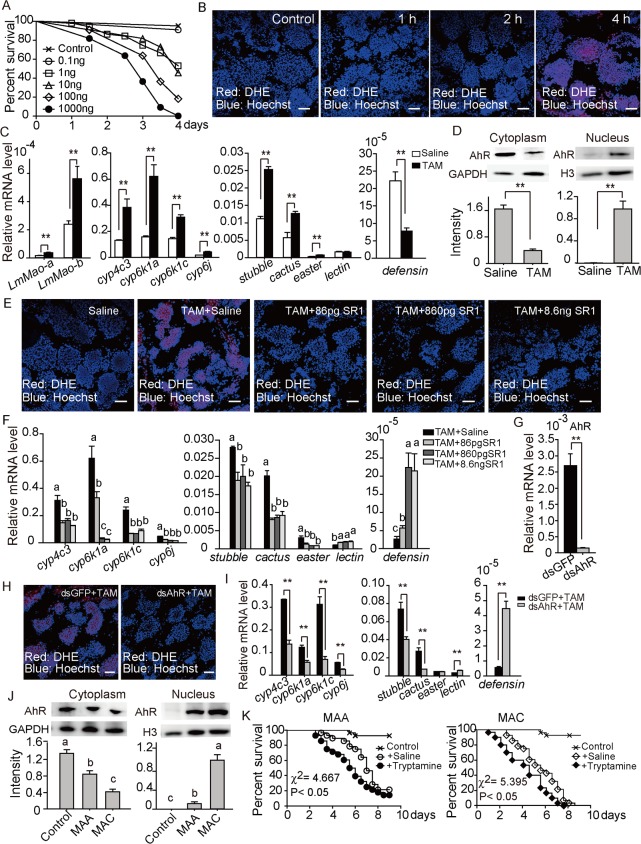
Fig 3. Tryptamine showed high toxicity to locusts.
(A) The locusts’ survival after the injection of different tryptamine dosages (0.1, 1, 10, 100, and 1000 ng/insect) showed the median lethal dose and sub-lethal dose. Data were calculated by using Kaplan–Meier methods and Probit methods in SPSS 20.0. (B) Fluorescent confocal microscopy imaging showed that the fungus with higher levels of tryptamine induced more ROS production in locust fat body cells. Red cells indicated that DHE staining the DNA of cells was degraded by ROS. Blue cells indicated Hoechst 33342 staining. Four hours after 10 ng tryptamine injection, ROS production was remarkably presented by observing DHE staining. (C) qPCR was used to analyze the gene expression induced by tryptamine (TAM) injection (10 ng per insect, after 4 h) in the fat body cells of locusts. The results showed that tryptamine could significantly induce the expression of LmMao-a, LmMao-b, CYPs, and immune genes (stubble, cactus, and easter) but suppress the expression of defensin. Data were presented as mean ± SEM. ** indicated P < 0.01. Bar, 100 μm. Blue: nucleus, red: DHE-stained cells (D), Immunoblot analysis was used to observe the AhR receptor translocation between the cytoplasm and nuclear space. Tryptamine (10 ng per insect) significantly induced AhR translocation 4 h after injection. GAPDH and histone H3 were used as the internal controls for loading proteins of cytoplasmic and nuclear proteins, respectively. The band intensity was calculated by using Quantity One (Bio-rad, USA). The data were presented as mean ± SEM and analyzed by using one-way ANOVA. Different lowercase letters indicated significance at P < 0.05. (E) Fluorescent confocal microscopy imaging showed that the tryptamine inhibitor SR1 (86 pg, 860 pg, and 8.6 ng per insect) reduced the ROS production of tryptamine (10 ng per insect) in fat body cells. Bar, 100 μm. Blue: nucleus, red: DHE-stained cells. (F), qPCR was used to observe the expression of detoxification and immune genes affected by tryptamine (n = 6, different lowercase letters indicate significant difference at P < 0.05) after injecting different dosages (86, 860, and 8.6 μg/insect) of SR1. qPCR showed that SR1 suppressed the tryptamine-induced gene expression of CYPs, stubble, cactus, and easter genes in the fat body cells of locusts but induced the tryptamine-suppressed gene expression of defensin. The data were presented as mean ± SEM and calculated by one-way ANOVA in SPSS 20.0 software. TAM: tryptamine. (G) Moreover, dsRNA injection (20 μg/insect) of AhR effectively suppressed the LmAhR expression by qPCR analysis. (H) dsRNA injection successfully reduced the TAM induction of ROS production in fat body cells. Bar, 100 μm. Blue: nucleus, red: DHE-stained cells. TAM: tryptamine. Consequently, (I) the reduction of AhR expression by RNAi showed the same effects of SR1 on the mRNA level of detoxification and immune genes. All data were presented as mean ± SEM and analyzed by Student’s t-test. **, P < 0.01. TAM: tryptamine. (J) Immunoblot analysis was used to observe the receptor translocation between the cytoplasm and nuclear space and detect the activation of tryptamine receptor AhR. The results showed that MAA and MAC infections induced AhR translocation. (K) Locusts were injected with tryptamine (100 pg/individual) before fungal infection to determine the toxicity of tryptamine. The results showed that tryptamine enhanced the lethality of fungi MAA and MAC to locusts. The survival curves of the insects were calculated by using Kaplan–Meier methods (P < 0.05).

