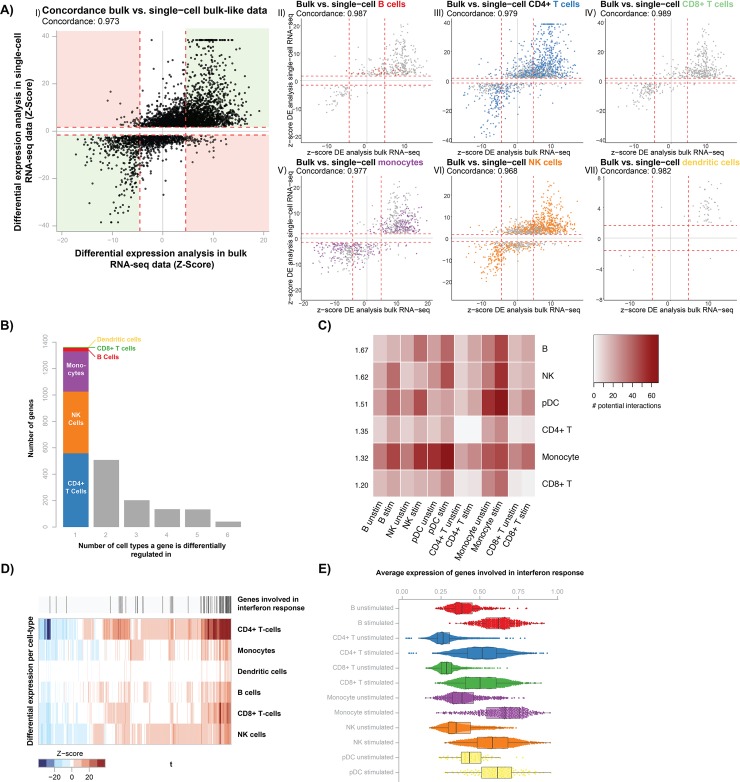
Fig 1. Single-cell RNA-seq differential expression analysis reveals the cell type-specific response to Candida stimulation.
(A) Comparison of differentially expressed (DE) genes upon Candida stimulation identified in 6 individuals for whom single-cell RNA-seq (scRNA-seq) data is generated (y-axis) as compared to the effect in 70 bulk RNA-seq samples (x-axis). Each dot represents a DE gene and the dotted red lines indicate the significance thresholds. In panel I (DE genes in bulk-like scRNA-seq sample, which contains all cells from an individual), concordant DE genes are shown in the green area and discordant genes in the red area. In panels II-VII (DE genes in specific cell type), color indicates whether a DE gene is cell type-specific. (B) Bar plot showing the sharedness of DE genes across cell types. The first bar, with cell type-specific DE genes, is colored based on the cell type in which the DE gene is found. (C) Heatmap of the total number of ligand-receptor interactions between cells of the same or different cell types. Each cell type is compared to cell types of the same condition (RPMI control left, 24h Candida-stimulation right). Each row has a number showing the average fold enrichment in ligand-receptor pair interactions between that cell type and all cell types. (D) Heatmap of DE gene Z-scores per cell type (y-axis) for genes that are identified as DE in more than one cell type (x-axis). Red colors indicate upregulation and blue colors show downregulation upon Candida stimulation. Above the heatmap, genes found within the interferon pathway are highlighted. (E) Box plots showing the mean expression of interferon pathway-associated genes (x-axis) for each cell type and stimulation condition (y-axis). Box plots show the median, first and third quartiles, and 1.5× the interquartile range and each dot represents the expression of a single cell.

