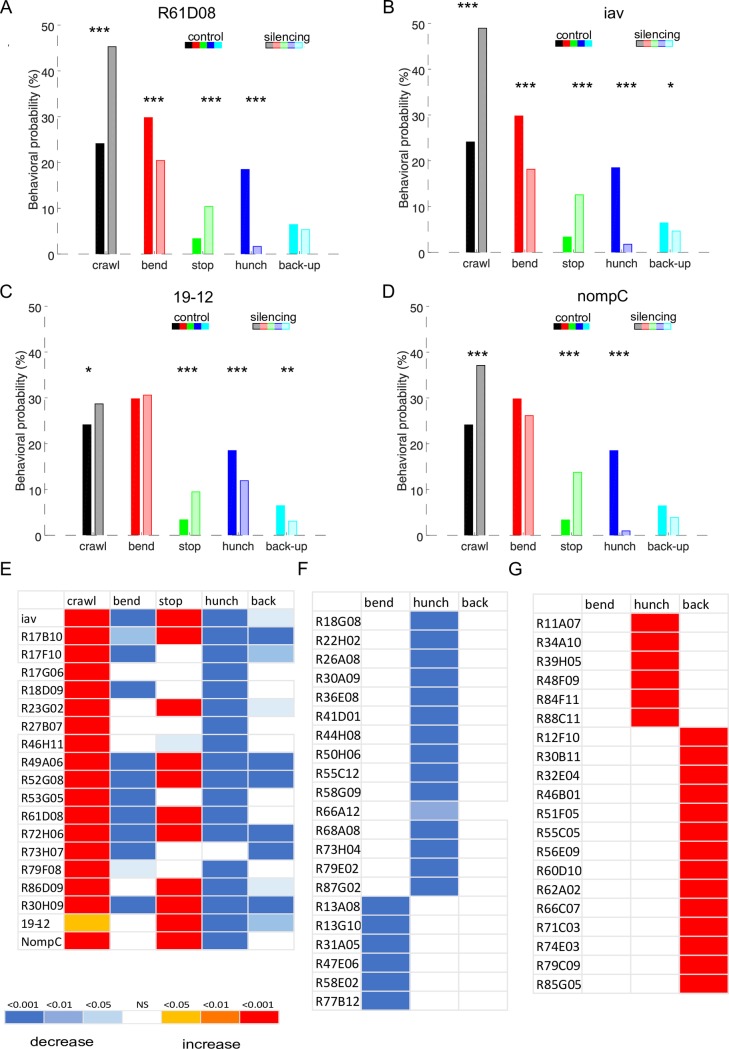
Fig 3. Sensory and central neuron lines with affected behavioral probabilities.
A-D. Behavioral probabilities for sensory lines driving UAS-TNT-e. A-B. Using our behavioral detection method we find that silencing chordotonals with tetanus-toxin using iav and R61D08 drivers results in significantly less Hunches and less Bends in response to air-puff compared to the control, as we have shown previously [10,21,38] as well as less Back-up. C. silencing of md class III sensory neurons results in less Hunches and less Back-ups D. Silencing of md III and subsets of chordotonals results in less Hunches E-G Phenotypic summaries for the hits from the behavioral screen. The colors in the heatmap represent the p-values for each behavior for the comparison between each line shown to the right of each plot to the w; attP2-TNT control E. Sensory lines with phenotypes (19 lines). Known types of sensory neurons are shown in S5 Table F. CNS lines (41 lines). Hits with lower probabilities in one behavior compared to the control (21 lines). G: Hits with higher probabilities in one behavior compared to the control (20 lines). The behavioral probabilities and p-values can be found in S5 and S6 Tables and the S2 Data file.

