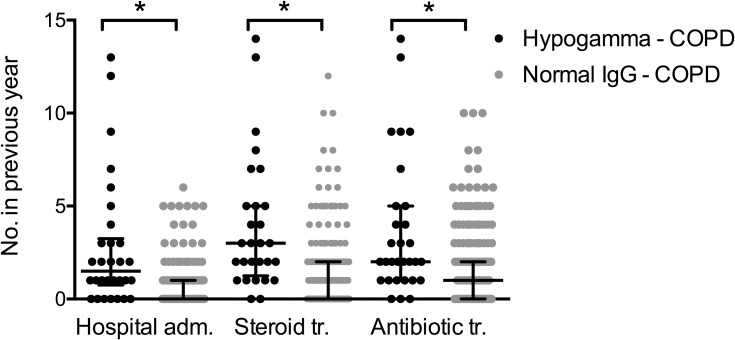
Figure 2.
Acute exacerbations of COPD in hypogamma-COPD vs normal-IgG-COPD. Black dots: COPD patients with IgG <6.1 g/L, grey dots: COPD patients with normal IgG levels. Black lines indicate median and interquartile range. *Indicates significant difference (p<0.0001, Mann–Whitney test). Hospital adm., hospital admissions; Steroid tr., oral steroid treatments; Antibiotic tr., antibiotic treatments.

