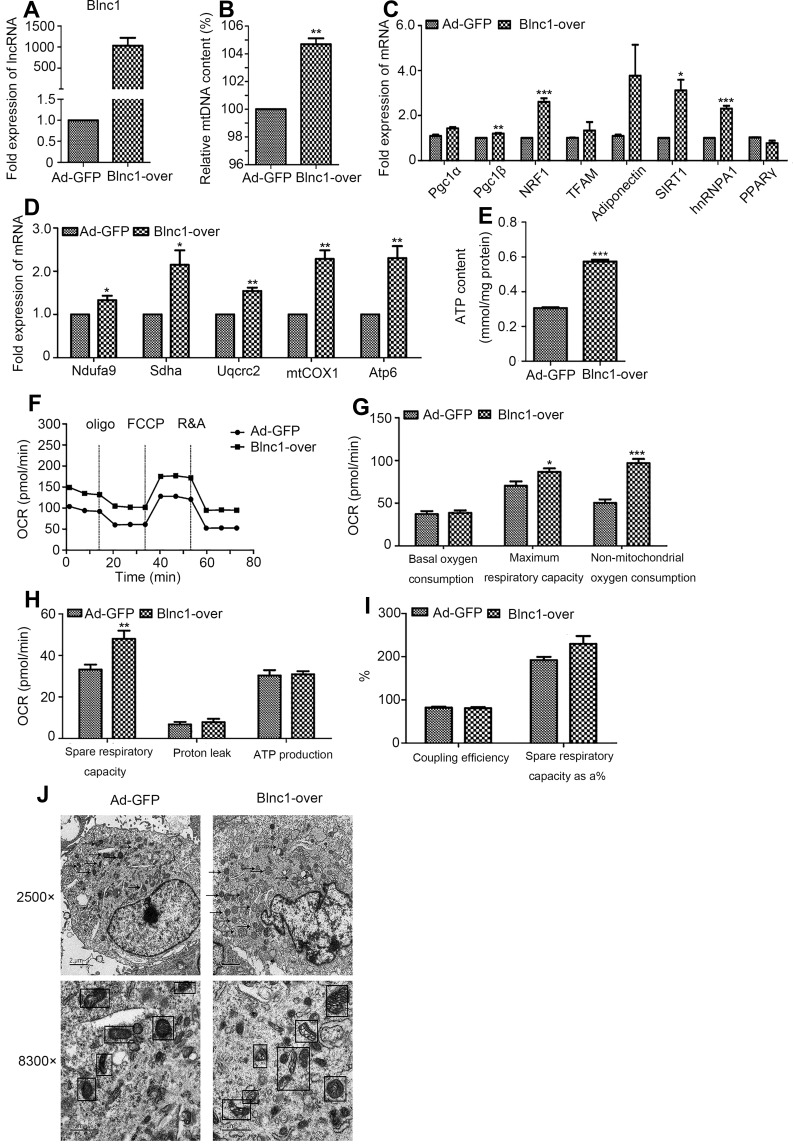
Figure 4.
(A) mRNA level of Blnc1 following treatment with Ad-GFP or Ad-Blnc1 adenovirus; (B) mtDNA content of 3T3-L1 pre-adipocytes; (C, D) expression of genes related to mitochondrial biogenesis and function by qRT-PCR; (E) ATP content; and (F – I) OCR. Dotted lines indicate injection of the respiratory inhibitors oligomycin (Oligo), FCCP, and rotenone and antimycin (R&A). (J) Representative TEM images of the mitochondrial ultrastructure of Ad-GFP and Blnc1-overpressing cells. Arrows and squares indicate mitochondria. Scale bars = 2, 1 μm. *p < 0.05, **p < 0.01, ***p < 0.001, Ad-GFP vs. Blnc1-over groups.

