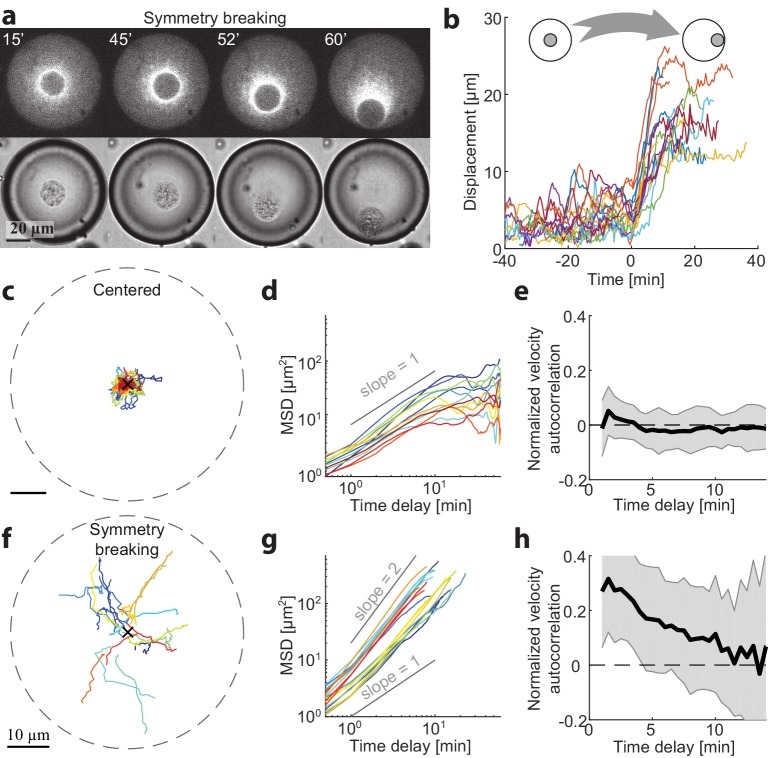
Figure 2. Dynamics of centering and symmetry breaking.
The dynamics of the contraction center were followed by imaging droplets over time for an hour.(a) Spinning disk confocal (top) and Bright-field (bottom) images from a time lapse movie (Video 3) of a droplet that starts in a centered state and breaks symmetry to become polar. (b) The symmetry breaking transition of droplets from a symmetric state to a polar state was characterized in 18 different droplets. The displacement of the aggregate from the center of the droplet is shown as a function of time for the different droplets. Time zero is defined as the onset of symmetry breaking for each droplet (see Materials and methods). (c-h) Analysis of the dynamics of aggregate position as a function of time in droplets in the centered state (c-e; N = 12) and during symmetry breaking (f-h; N = 18). (c,f) Tracks depicting the position of the aggregate in different droplets. (d,g) The mean squared displacement of aggregate positions as a function of time. The droplets in the centered state exhibit confined random fluctuations (d), whereas during symmetry breaking, the movement is directed (g). (e,h) The normalized velocity autocorrelation (mean ± STD; averaged over different droplets) is shown for the tracks on the left. The velocity autocorrelation (for t ≥ 0.5 min) is essentially zero in the centered state (e). During symmetry breaking, the aggregate velocity exhibits a positive correlation for time scales of up to ∼ 10 min (h).


