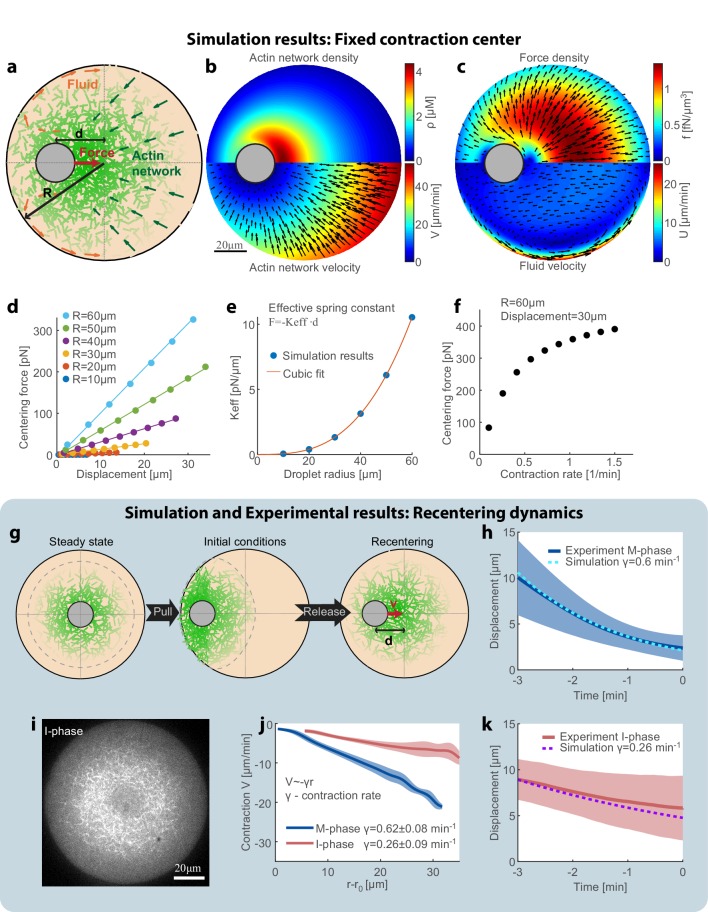
Figure 4. Recentering model: friction between the contracting network and the fluid cytosol generates a centering force.
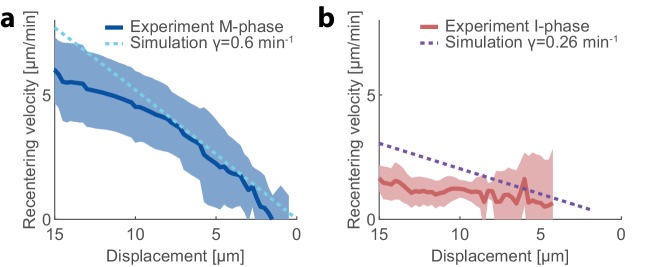
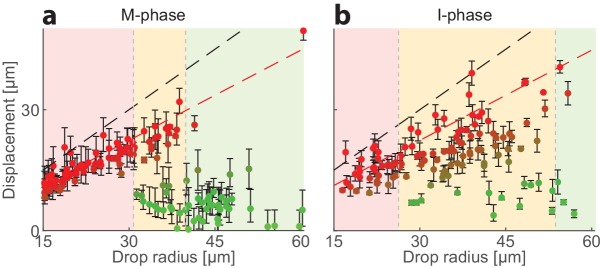
(a) Schematic illustration of the model. The system is modeled as a two-phase system composed of a contracting actin network and the surrounding fluid. (b–f) Simulation results of the model when the aggregate position is held fixed (Appendix 1). The simulation results for the steady-state actin network density and flow (b) and the surrounding fluid flow and force density (c) are shown. (d) The centering force is calculated from the simulation as the net force exerted on the aggregate as a function of the displacement from the droplet center at steady-state. The net centering force is plotted as a function of the displacement for droplets of different sizes (dots- simulations results; line- linear fit). (e) The effective spring constant of the centering force, determined from the slope of the linear fit to the simulation results in (d), is plotted as a function of the droplet radius (R). The effective spring constant increases as R3. (f) The centering force is plotted as a function of the network contraction rate. The centering for was calculated for a displacement of 30 µm in a droplet with a radius of R = 60 µm. The centering force increases with network contraction. (g–k) In the dynamic model (Appendix 1), the aggregate position is part of the dynamic variables of the system and moves according to the net force acting on it. (g) Schematic illustration of the dynamic model used to model the magnetic perturbation experiments. The initial conditions are obtained by displacing a centered steady-state configuration toward the side. Subsequently, the dynamics of the system lead to recentering of the aggregate. (h) The simulation results for the displacement of the aggregate as a function of time (dashed line) are compared to the average displacement determined experimentally in M-phase extracts (standard condition) (blue line; mean ± STD; Figure 3e). (i) Spinning-disk confocal image of the equatorial cross section of an I-phase extract droplet. The actin network is labeled with GFP-Lifeact. (j) Network contraction velocity measured as a function of distance from the inner network boundary, for M-phase and I-phase extracts (mean ± STD). The contraction rate, γ, is determined from the slopes of linear fits to the data (Malik-Garbi et al., 2019). (k) The simulation prediction for the displacement of the aggregate as a function of time (dashed line) are compared to the average displacement determined experimentally in I-phase extracts (red line; mean ± STD). The observed average I-phase contraction rate is used as an input for the simulation which contains no additional fit parameters.


