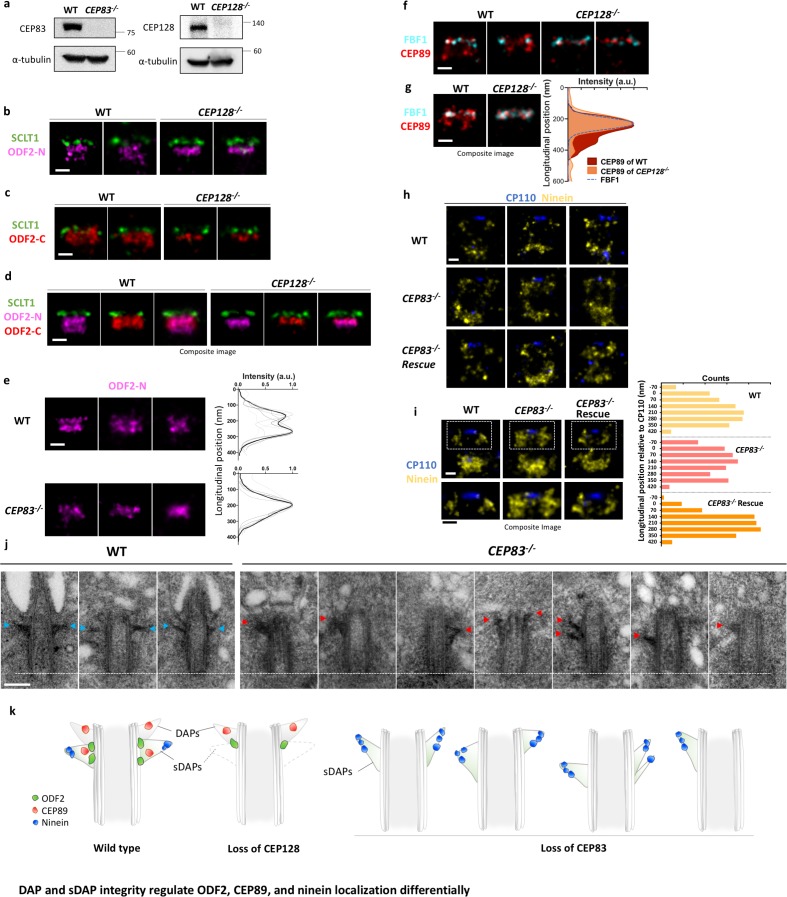
Figure 4. DAP and sDAP integrity regulates ODF2, CEP89, and ninein localization differentially.
(a) Immunoblotting confirming knockout of CEP83 or CEP128 in RPE-1 cells. WT, wild-type RPE-1 cells; CEP128–/–, CEP128 knockout RPE-1 cells. (b, c) Representative two-color dSTORM images of (b) the N-terminus of ODF2 and (c) the C-terminus of ODF2 with SCLT1 in WT cells and CEP128–/– cells. (d) Two-color dSTORM images in panels (b) and (c) aligned and combined according to their longitudinal positions relative to SCLT1 (n = 5 centrioles per group). (e) (Left) Representative dSTORM images of ODF2 in WT and CEP83 knockout RPE-1 cells (CEP83–/–). (Right) Intensity profile of WT and CEP83–/– cells (WT, n = 7 centrioles; CEP83–/–, n = 6 centrioles) showing that ODF2 becomes a single-layer structure when CEP83 is depleted. (f) Representative two-color dSTORM images of CEP89 and FBF1 in WT and CEP128–/–cells. (g) (Left) Two-color dSTORM images in panel (e) aligned and combined according to their longitudinal positions relative to FBF1 (WT, n = 5 centrioles; CEP128–/–, n = 6 centrioles). (Right) Intensity profile of the images in the left panel showing that the lower layer of CEP89 is absent in the CEP128–/– cells. (h) Representative two-color dSTORM images of ninein and CP110 in WT, CEP83–/–, and CEP83–/– cells stably expressing wild-type CEP83 protein (CEP83–/–Rescue). (i) (Left, top) Two-color dSTORM images in panel (g) aligned and combined according to their longitudinal positions relative to CP110 (WT, n = 5 centrioles; CEP83–/–, n = 6 centrioles; CEP83–/–Rescue, n = 5 centrioles). (Left, bottom) Magnified images of the insets in the top row. (Right) Histograms for the images on the left revealing that ninein is distributed towards the centriole distal end in CEP83–/– cells as compared to that in WT and CEP83–/–Rescue cells. (j) TEM of the mother centriole of WT and CEP83–/–RPE-1 cells. sDAPs in the WT and CEP83–/–cells are marked by blue and red arrowheads, respectively. (k) Cartoon model illustrating the changes in sDAP protein localization upon CEP128 depletion and the variations of sDAP structure upon CEP83 depletion. Bars = 200 nm.


