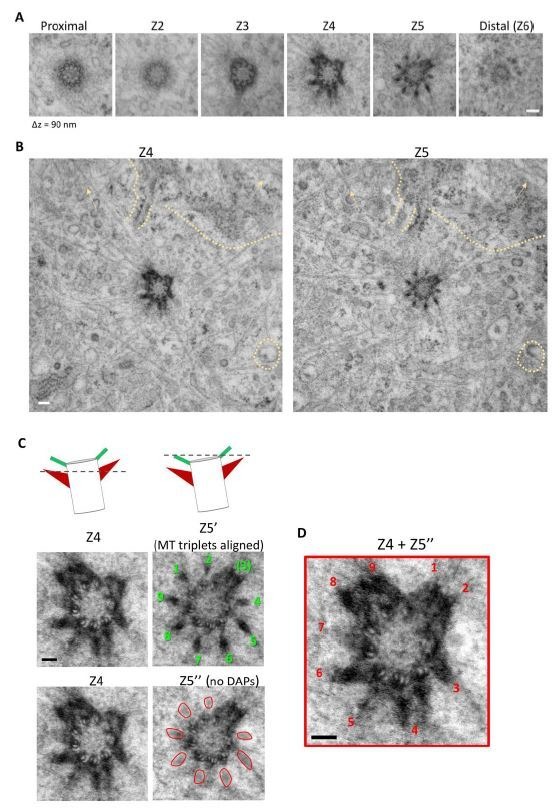
Author response image 6. Serial TEM imaging of a mother centriole in a wild type RPE-1 cell from Figure 1I.

(A) The serial TEM sections from Figure 1I. Longitudinal difference between each plane is around 90 nm (B) TEM images of the Z4 and Z5 planes assuring alignment of the images. Similarity in background signals between the two planes are indicated by dashed line and arrows. (C) (Left top panel) A cartoon illustrating the orientation of the Z4 and Z5 planes of the centriole; a dashed line represents the z position of the TEM section. (Left middle panel) Rotational alignment of MT triplets in Z5 plane to that of the Z4 plane; the nine DAPs are indicated by numbers in green. (Left bottom panel) Removal of DAP signal (marked by red circular shapes) in the Z5' image. (Right) Stacking of Z4 and Z5'' images to reveal the position of the nine sDAP stems as indicated by numbers in red. Bars = 100 nm.
