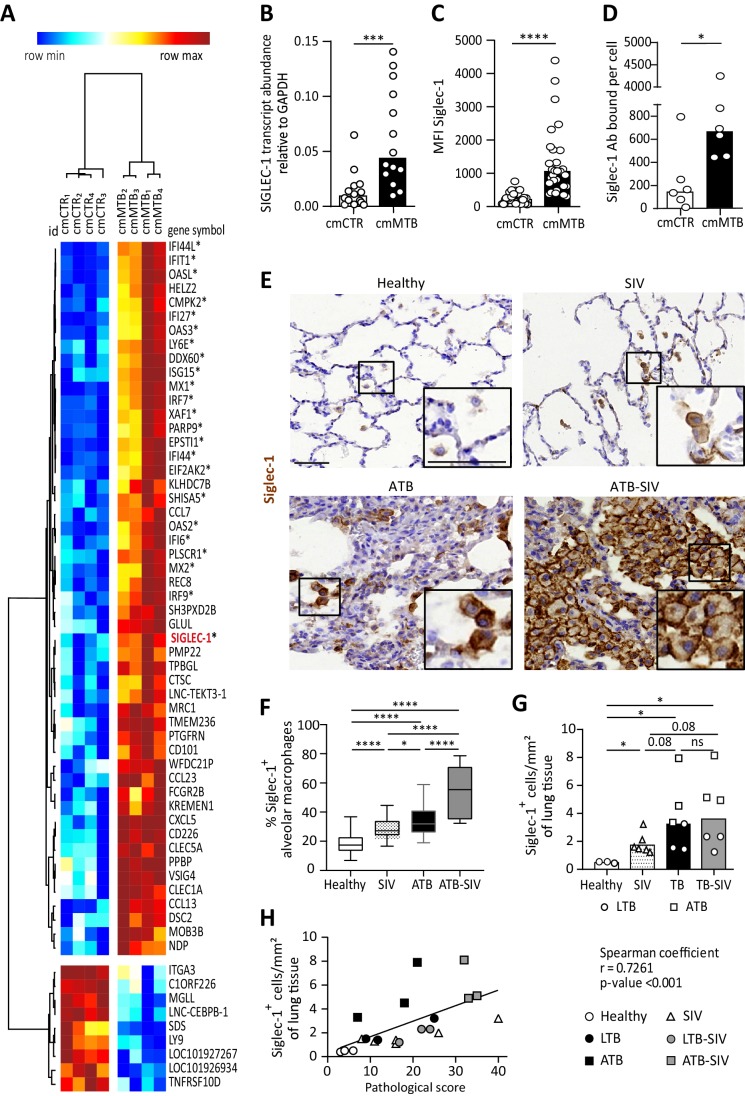
Figure 1. Tuberculosis-associated microenvironments induce Siglec-1 expression in macrophages.
(A–D) For 3 days, human monocytes were differentiated into macrophages with cmCTR (white) or cmMTB (black) supernatants. (A) Heatmap from a transcriptomic analysis (GEO submission GSE139511) illustrating the top 60 differentially expressed genes (DEGs) between cmCTR- or cmMTB-cells. Selection of the top DEGs was performed using an adjusted p-value ≤ 0.05, a fold change of at least 2, and a minimal expression of 6 in a log2 scale. Hierarchical clustering was performed using the complete linkage method and the Pearson correlation metric with Morpheus (Broad Institute). Interferon-stimulated genes (ISG) are labelled with an asterisk and Siglec-1 is indicated in red. (B–D) Validation of Siglec-1 expression in cmMTB-treated macrophages. Vertical scatter plots showing the relative abundance to mRNA (B), median fluorescent intensity (MFI) (C), and mean number of Siglec-1 antibody binding sites per cell (D). Each circle represents a single donor and histograms median values. (E) Representative immunohistochemical images of Siglec-1 staining (brown) in lung biopsies of healthy, SIV infected (SIV), active TB (ATB), and co-infected (ATB-SIV) non-human primates (NHP). Scale bar, 100 µm. Insets are 2x zoom. (F) Vertical Box and Whisker plot indicating the distribution of the percentage of Siglec-1+ alveolar macrophages in lung biopsies from the indicated NHP groups. Quantification analysis from n = 800 alveolar macrophages grouped from three independent animals per NHP group. (G) Vertical scatter plots displaying the number of cells that are positive for Siglec-1 per mm² of lung biopsies from the indicated NHP groups. Each symbol represents a single animal per NHP group. (H) Correlation between Siglec-1+ cells per mm² of lung tissue and the pathological score for healthy (white circle), SIV+ (white triangles), latent (black circle) or active (black square) TB, and SIV+ with latent (grey circle) or active (grey square) TB. Each symbol represents a single animal per NHP group. Mean value is represented as a black line. Statistical analyses: Two-tailed, Wilcoxon signed-rank test (B–D), Mann-Whitney unpaired test (F–G), Spearman correlation (H). *p<0.05, **p<0.01, ***p<0.001, ****p<0.0001. ns: not significant. See Figure 1—source data 1.


