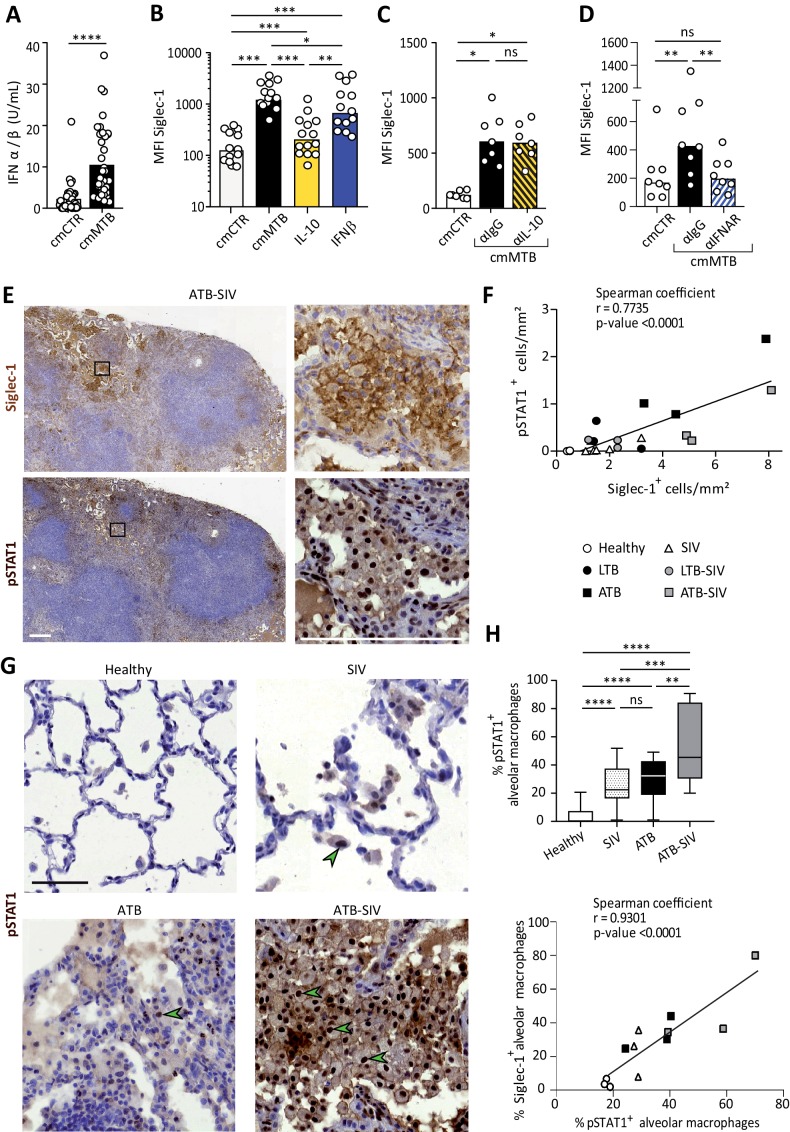
Figure 2. Siglec-1 expression is dependent on Mtb-induced type I IFN signaling.
(A) Vertical scatter plot showing the relative abundance of IFN-I in cmCTR (white) and cmMTB (black) media, as measured indirectly after 24 hr exposure to the HEK-Blue IFN-α/β reporter cell line yielding reporter activity in units (U) per mL. (B–D) Vertical scatter plots displaying the median fluorescent intensity (MFI) of Siglec-1 cell-surface expression after three days of monocyte differentiation into macrophages either with cmMTB (black) or cmCTR (white), the indicated recombinant cytokines (B), the presence of an IL-10 depletion (α-IL-10) or a control (α-IgG) antibodies (C), or the presence of an IFNAR-2 blocking (α-IFNAR) or control (α-IgG) antibodies (D). (E) Representative serial immunohistochemical images of lung biopsies of a co-infected (ATB-SIV) NHP stained for Siglec-1 (brown, top) and pSTAT1 (brown, bottom). Scale bar, 250 µm. Insets are 10x zooms. (F) Correlation of the percentage of cells positive for Siglec-1 and pSTAT1, as measured per mm2 of lung tissue from the indicated NHP groups. Mean value is represented as a black line. (G) Representative immunohistochemical images of lung biopsies from the indicated NHP group stained for pSTAT1 (brown). Arrowheads show pSTAT1-positive nuclei. Scale bar, 500 µm. (H) Upper panel: Vertical Box and Whisker plot illustrating the percentage of pSTAT1+ alveolar macrophages in lung biopsies from the indicated NHP groups. Quantification analysis from n = 600 alveolar macrophages grouped from three independent animals per NHP group. Lower panel: Correlation of the percentage of alveolar macrophages positive for Siglec-1 and pSTAT1, from the indicated NHP groups. Mean value is represented as a black line. (A–D) Each circle within vertical scatter plots represents a single donor and histograms median value. Statistical analyses: Two-tailed, Wilcoxon signed-rank test (A–D), Spearman correlation (F, H lower panel), and Mann-Whitney unpaired test (H, upper panel). *p<0.05, **p<0.01, ***p<0.001, ****p<0.0001. ns: not significant. See Figure 2—source data 1.

