. 2020 Mar 30;9:e52535. doi: 10.7554/eLife.52535

Figure 3. Siglec-1 localization on thick TNT is associated with their length and HIV-1/mitochondria cargo.

(A–F) Human monocytes were differentiated into macrophages with cmMTB for 3 days, and then infected with HIV-1-ADA strain (unless indicated otherwise) and fixed 3 days post-infection. (A) Representative immunofluorescence images of cmMTB-treated macrophages infected with HIV-1-ADA, and stained for extracellular Siglec-1 (red), intracellular tubulin (MT, green) and Wheat Germ Agglutinin (WGA, blue). Inserts are 3x zooms. Red arrowheads show Siglec-1 localization on TNT. Scale bar, 20 µm. (B) Vertical bar plot showing the semi-automatic quantification of Siglec-1+ TNT (black) and Siglec-1- TNT (white) in thick (WGA+, MT+) and thin (WGA+, MT-) TNT. 400 TNT were analyzed from two independent donors. (C) Siglec-1+ TNT exhibit a larger length index. Violin plots displaying the semi-automatic quantification of TNT length (in μm) for thin (WGA+, MT-), and thick TNT (WGA+, MT+) expressing Siglec-1 or not. 400 TNT were analyzed per condition from two independent donors. (D) Representative immunofluorescence images of cmMTB-treated macrophages 3 day post-infection with HIV-1-NLAD8-VSVG strain, and stained for extracellular Siglec-1 (red), intracellular HIV-1Gag (green) and WGA (grey). Scale bar, 10 µm. (E) Vertical bar plots indicating the quantification of presence (dark grey) or absence (light grey) of HIV-1Gag in thick TNT (WGA+, MT+) expressing Siglec-1 or not. 120 TNT in at least 1000 cells were analyzed from four independent donors. (F) Representative immunofluorescence images of cmMTB-treated macrophages infected with HIV-1-ADA loaded with MitoTracker (MitoT, green), and stained for extracellular Siglec-1 (red) and WGA (grey). Inserts are 3x zooms. Green arrowheads show mitochondria inside TNT. Scale bar, 10 µm. Statistical analyses: Two-way ANOVA comparing the presence of Siglec-1 in thin and thick TNT (B), and two-tailed Mann-Whitney unpaired test comparing TNT length (C) and the presence of HIV-1 in TNT (E). *p<0.05, ****p<0.0001. See Figure 3—source data 1.

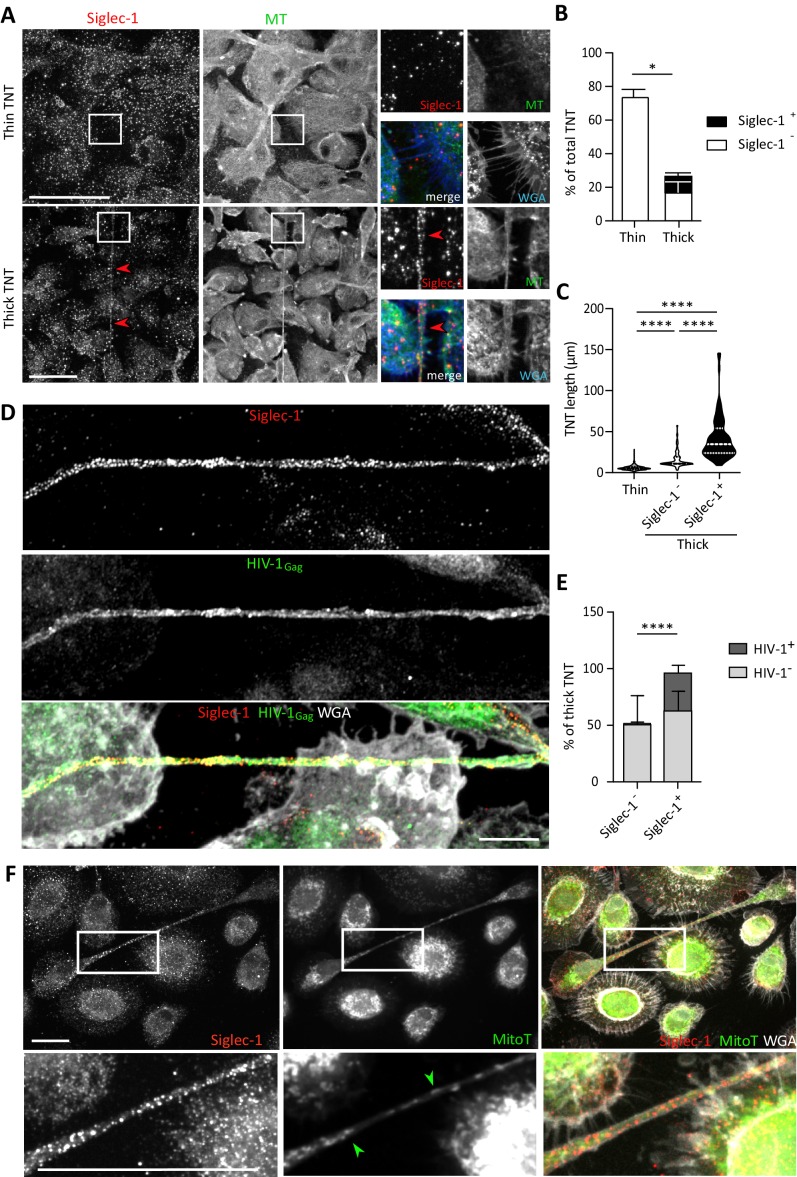
Figure 3—source data 1. Raw data and statistical analyses supporting Siglec-1 expression on thick TNT and its correlation with TNT length.

Figure 3.

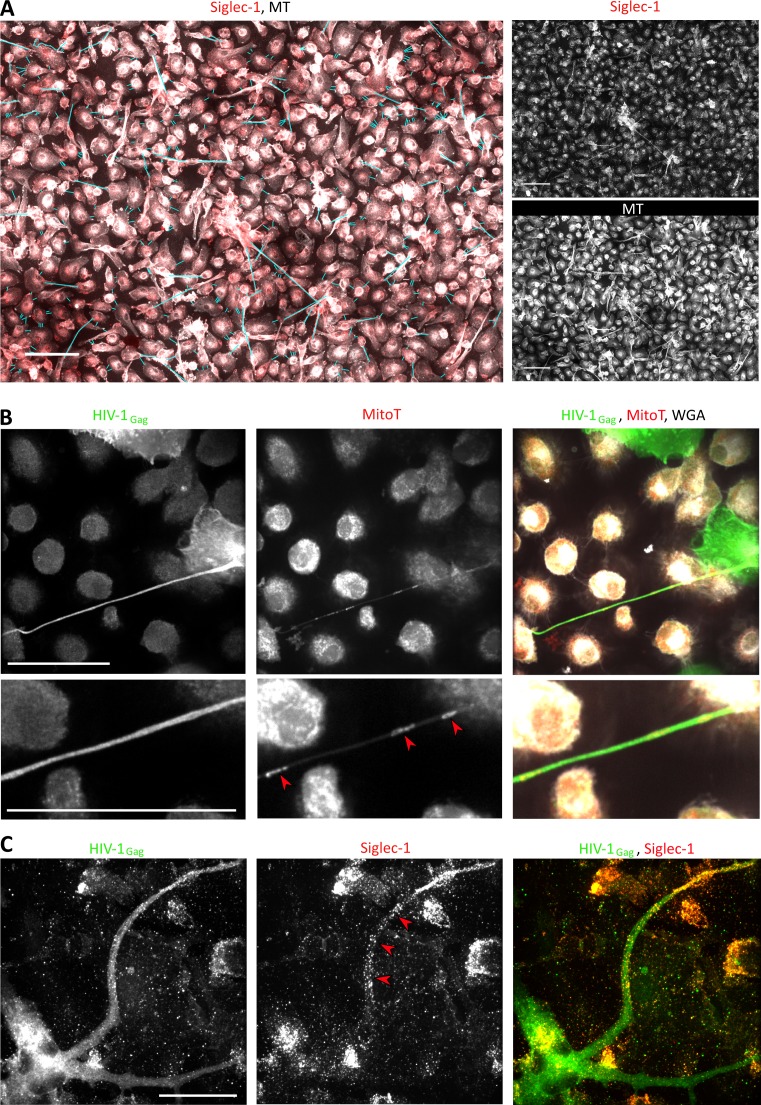
Figure 3—figure supplement 1. Siglec-1 localizes specifically on thick tunneling nanotubes that contain HIV-1Gag and mitochondria.

Figure 3—figure supplement 1.

(A–C) Human monocytes were differentiated into macrophages with cmMTB for 3 days, infected with HIV-1-ADA strain (unless indicated otherwise) and then fixed at day 3 (A–B) or 14 (C) post-infection. (A) Representative immunofluorescence images used for semi-automatic quantification of TNT in cmMTB-treated macrophages infected with HIV-1. Cells were stained for extracellular Siglec-1 (red), intracellular tubulin (MT, grey) and Wheat Germ Agglutinin (WGA, not shown). Blue lines show all TNT considered. Thick (WGA+, MT+) and thin (WGA+, MT-) TNT were assessed for Siglec-1 positivity by applying a threshold and measured in length. Scale bar, 20 µm. (B) Representative immunofluorescence images of cmMTB-treated macrophages infected with HIV-1-NLAD8-VSVG, loaded with Mitotracker (MitoT, red) and stained for intracellular HIV-1Gag (green) and WGA (grey). Red arrowheads show mitochondria inside HIV-1Gag-containing TNT. Inserts are 2x zoom. Scale bar, 20 µm. (C) Representative immunofluorescence images of cmMTB-treated macrophages infected with HIV-1 and kept in culture until day 14. Cells were fixed and stained for intracellular HIV-1Gag (green), extracellular Siglec-1 (red) and WGA (grey). Red arrowheads show Siglec-1 on HIV-1Gag-containing TNT emanating from an infected multinucleated giant cell (MGC). Scale bar, 20 µm.
Figure 3—video 1. Related to Figure 3A.
Download video file (2.3MB, mp4)
Z-stack of confocal microscopy images, showing Siglec-1 (red), microtubules (MT, green) and F-actin (grey) of day 6 HIV-1-infected macrophages, treated with cmMTB. Siglec-1 localizes on the thick MT+ F-actin+ TNT but not on thin MT- F-actin+ TNT.
Figure 3—video 2. Related to Figure 3D.
Download video file (2.1MB, mp4)
3D reconstitution of confocal images, showing Siglec-1 (red), HIV-1Gag (green) and WGA (grey) of day 6 HIV-1-infected macrophages, treated with cmMTB.