. 2020 Mar 30;9:e52535. doi: 10.7554/eLife.52535

Figure 4. The exacerbation of HIV-1 infection and spread in macrophages treated with cmMTB requires Siglec-1.

(A) Experimental design. Monocytes from healthy subjects were transfected with siRNA targeting of Siglec-1 (siSiglec-1, black) or not (siCtrl, white). A day after, monocytes were differentiated into macrophages with cmMTB for 3 days. Cells were then infected with HIV-1-ADA (blue protocol) to measure the formation (B) and length (C) of TNT at day 7, or assess HIV-1 production and multinucleated giant cell (MGC) formation at day 14 (F–G). In parallel, cells were either infected with HIV-NLAD8-VSVG or labelled with mitoTracker to measure the transfer (red protocol) of HIV-1 (D) or mitochondria (E), respectively. (B) Before-and-after plots showing the percentage of cells forming thick TNT (F-actin+, WGA+, MT+). (C) Violin plots displaying the semi-automatic quantification of TNT length (in μm) for thick (WGA+, MT+) TNT; 300 TNT were analyzed per condition from two independent donors. (D–E) Before-and-after plots indicating the percentage of HIV-1Gag+ cells (D) or MitoTracker+ cells (E) among CellTracker+ cells after 24 hr co-culture. (F) Representative immunofluorescence images of siRNA transfected cells treated with cmMTB, 14 days post-HIV-1 infection. Cells were stained for intracellular HIV-1Gag (green), F-actin (red) and DAPI (blue). Scale bar, 500 µm. (G) Vertical scatter plots showing HIV-1-p24 concentration in cell supernatants (upper panel) and percentage of MGC (lower panel) at day 14 post-HIV-1 infection in cells represented in F (siSiglec-1, black; siCtrl, white). (B, D, E and G) Each circle represents a single donor and histograms median value. Statistical analyses: Paired t-test (B, G lower panel) or two-tailed, Wilcoxon signed-rank test (C-E, G upper panel). *p<0.05, **p<0.01, ****p<0.0001. See Figure 4—source data 1.

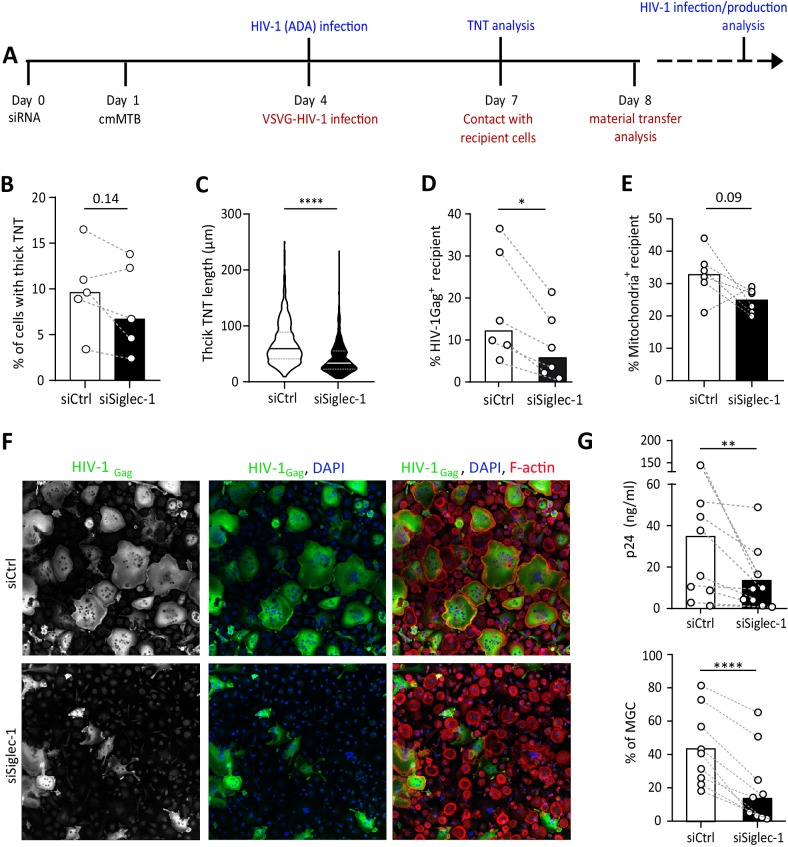
Figure 4—source data 1. Raw data and statistical analyses supporting a role for Siglec-1 in TNT length, HIV-1 and mitochondrial cell-to-cell trasfer, and exacerbation of HIV-1 infection.

Figure 4.

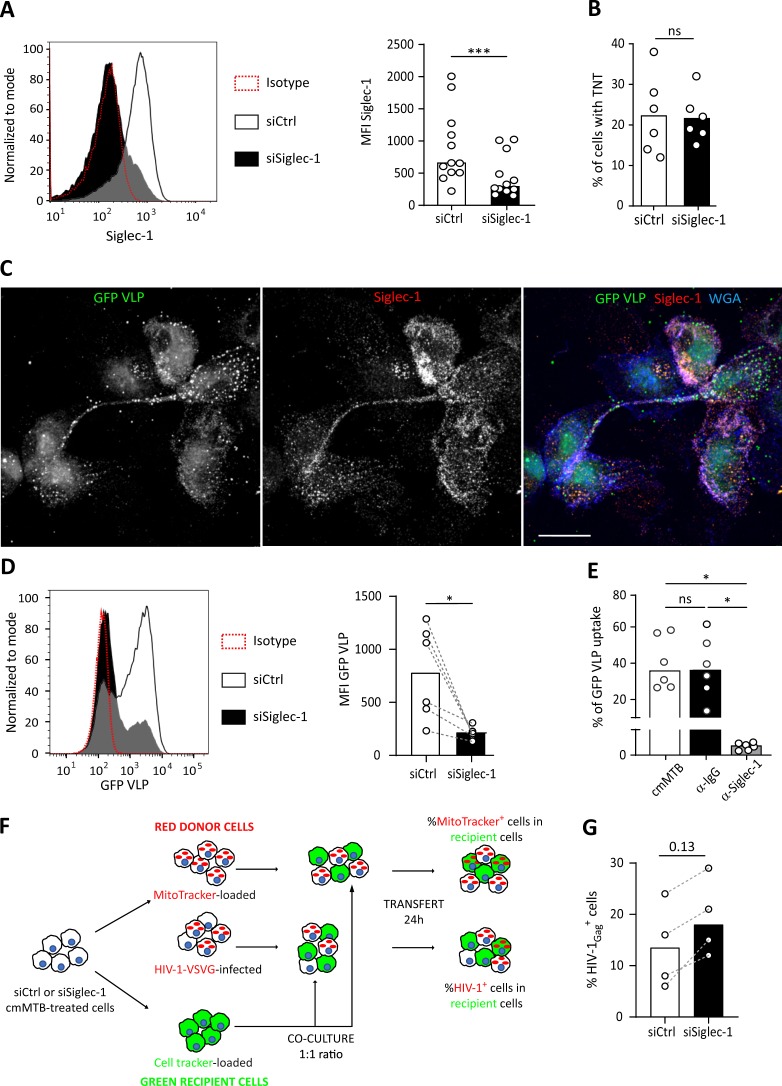
Figure 4—figure supplement 1. Siglec-1 is required for the capture and transfer of HIV-1 in cmMTB-treated macrophages.

Figure 4—figure supplement 1.

(A–D, F–G) Monocytes from healthy subjects were transfected with siRNA targeting of Siglec-1 (siSiglec-1, black) or not (siCtrl, white). A day after, monocytes were differentiated into macrophages with cmMTB for 3 days. (A) Representative histogram (left) and vertical scatter plot showing the median fluorescent intensity (MFI) (right) of Siglec-1 expression on the indicated cell populations. (B) Vertical scatter plot indicating the percentage of cells forming TNT. (C–E) Inhibition of Siglec-1 reduces binding of HIV-1-Gag−eGFP virus like particles (GFP-VLP). (C) Representative immunofluorescence images of cmMTB-treated cells incubated with GFP-VLP (green) for 3.5 hr. Cells were fixed and stained for extracellular Siglec-1 (red) and Wheat Germ Agglutinin (WGA, blue). Scale bar, 500 µm. (D) Representative histogram (left) and vertical scatter plot showing the median fluorescent intensity (MFI) (right) displaying of GFP-VLP binding in the indicated cell populations. (E) Vertical scatter plot showing the percentage of GFP-VLP binding in cmMTB treated cells pre-incubated with specific anti-Siglec-1 (α-Siglec-1, grey), anti-Isotype control antibodies (α-IgG, black) or mock (white). (F) Schematics of the experimental procedure for material (HIV-1 and mitochondria) transfer experiments. (G) Vertical scatter plot showing the percentage of HIV-1Gag+ cells at the time of co-culture experiment in the indicated cells. Statistical analyses: Two-tailed, Wilcoxon matched-pairs signed rank test (A, B, D-E, G). *p<0.05, ***p<0.001. ns: not significant.
Figure 4—figure supplement 1—source data 1. Supplemental raw data and statistical analyses supporting the functional role of Siglec-1 in human macrophages using an siRNA-mediated gene silencing approach.