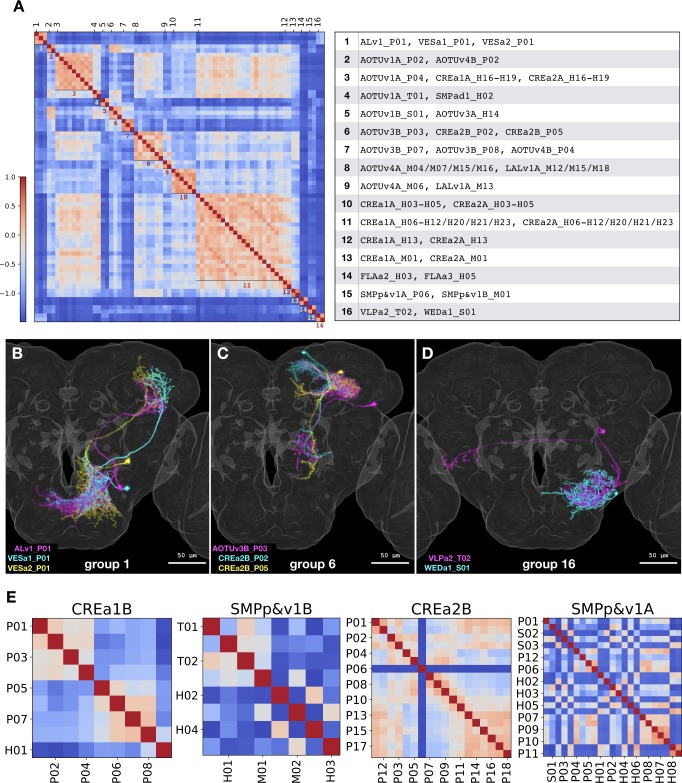
Figure 12. NBLAST analysis of inter- vs intra-hemilineage relatedness.
(A) Sixteen groups of morphologically related neuron types were recovered across independent hemilineages, based on the adjacency matrix derived from NBLAST scores larger than 0.3. Shown side by side are the heatmap of NBLAST scores and the list of Vnd neuron types for the 16 non-overlapping similarity groups. Note that the extensive CREa1A/CREa2A and AOTUv4A/LALv1A inter-hemilineage analogies account for all four (#3/8/10/11) large groups with six or more members. (B–D) Representative neurons of the related neuron types for the similarity group #1 (B), #6 (C), and #16 (D). Note extensive overlap in both proximal and distal (B and C) or just proximal neurite elaborations (D), despite distinct hemilineage-characteristic primary projections. (E) Heatmaps of intra-hemilineage NBLAST scores, sorted based on the birth-order of neuron types (indicated with alternating x-tick and y-tick labels). Note distinct temporal patterns of relatedness in diverse hemilineages. The CREa1B hemilineage displays progressive changes, and the SMPp&v1B hemilineage exhibits both progressive and cyclic changes. By contrast, the CREa2B and SMPp&v1A hemilineages yield more neuron types that appear in various cyclic manners. Please find the complete set of hemilineage NBLAST heatmaps in Figure 1—source data 1.

