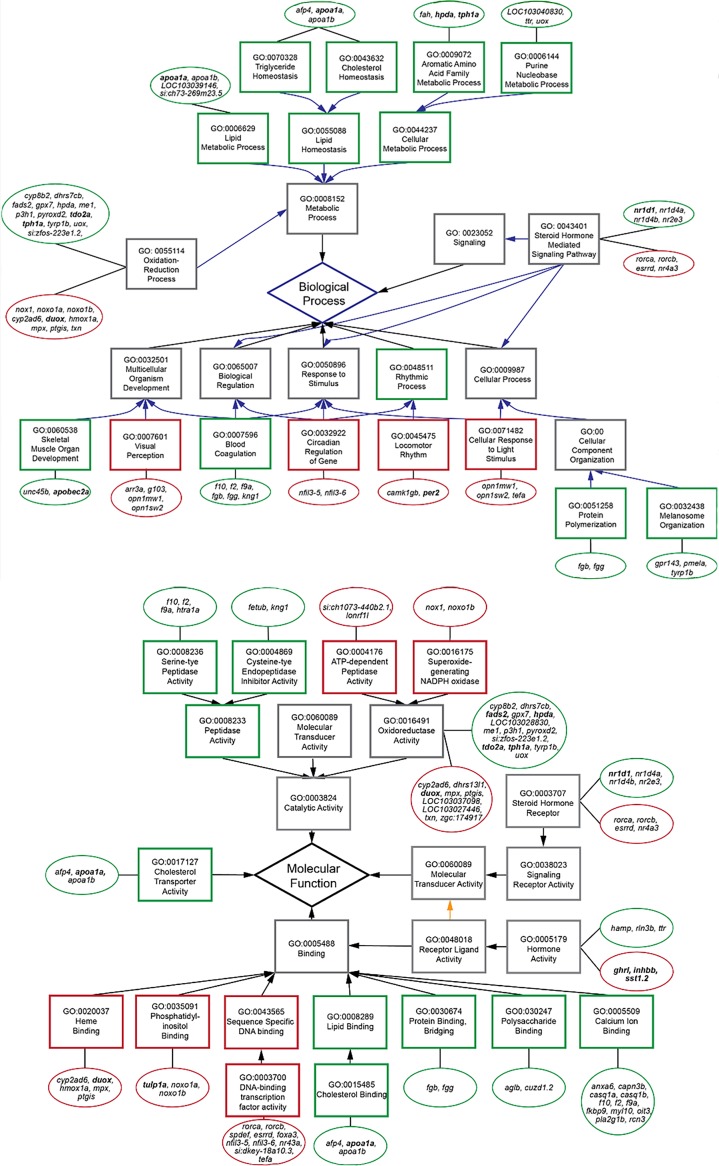
Figure 2. Subset of relevant, enriched GO terms (boxes) for biological processes (top) and molecular functions (bottom) of differentially expressed genes (circles) in the transcriptome.
Genes tested by RT-PCR are in bold. Red outlines are down-regulated terms and genes, and green outlines are up-regulated.

