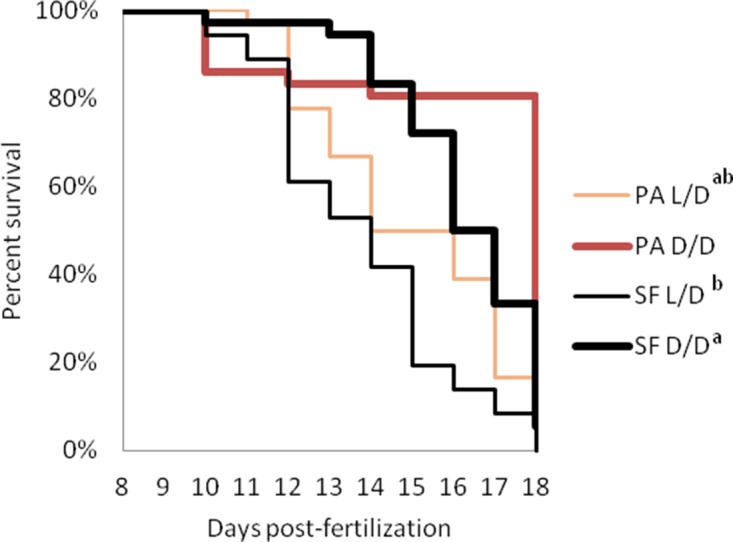
Figure 4. Survival curves of starvation resistance in Astyanax mexicanus surface fish (SF) and Pachón cavefish (PA) raised in complete darkness (D/D) or a normal photoperiod (L/D).

Graphs show the percent of surviving fish (from the initial 36) on each day. Groups of SF and PA larvae from each condition were starved starting at seven dpf. Vertical drops represent individuals lost at a given time point. Groups in the legend that share a superscript are not statistically different, p values calculated by Cox proportional hazards model followed by generalized linear hypothesis test. Figure 4—source data 1 contains raw data.
