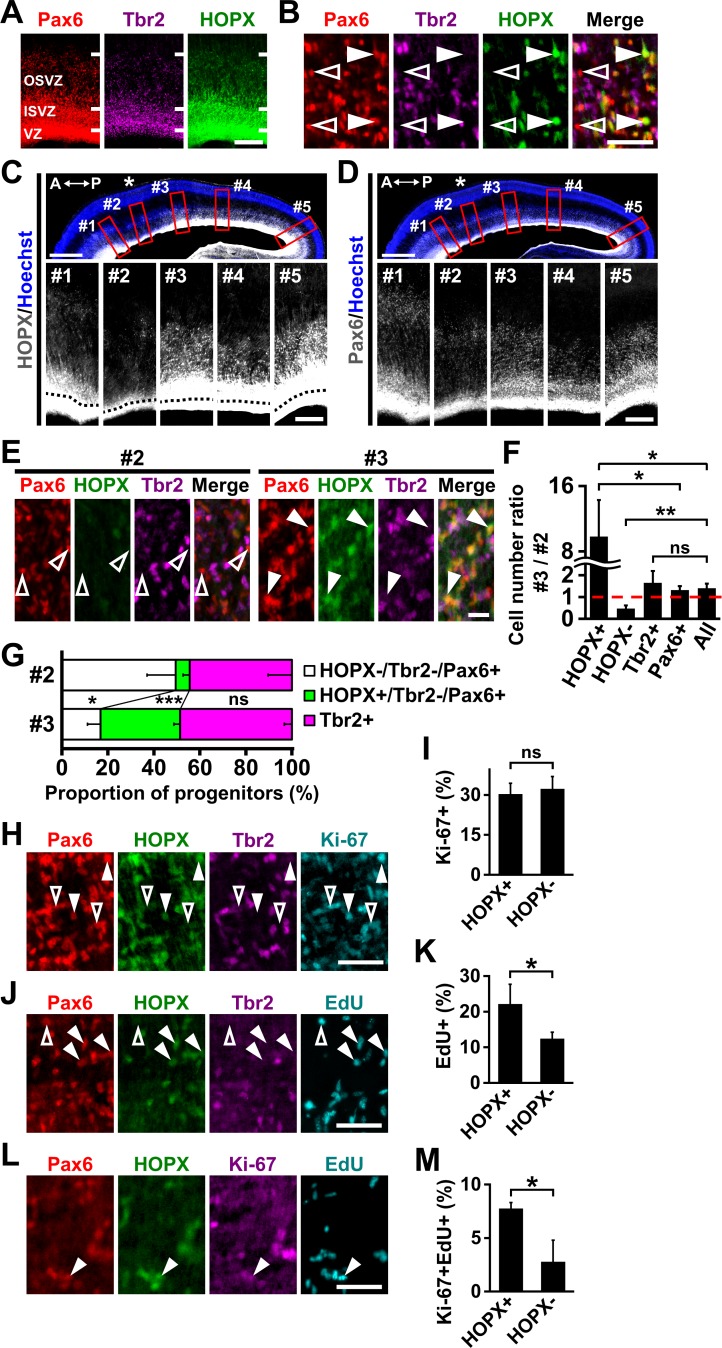
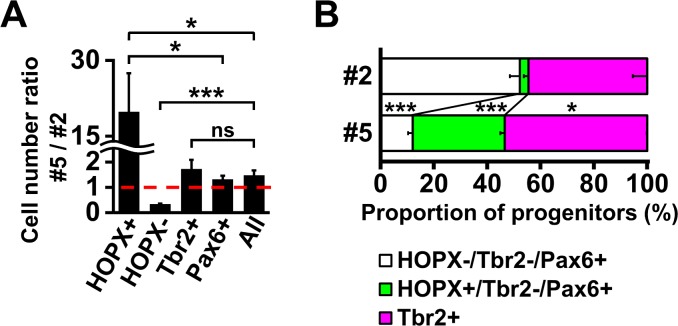
Figure 1. HOPX-positive oRG cells are preferentially distributed in prospective gyral regions in the developing ferret cerebral cortex.
(A, B) Sections of the ferret cerebral cortex at P1 were subjected to immunohistochemistry for Pax6, Tbr2 and HOPX. (B) Higher magnification images of the OSVZ are shown. HOPX was expressed in a subset of oRG cells (Pax6-positive and Tbr2-negative). Arrowheads and open arrowheads indicate HOPX-positive and HOPX-negative oRG cells, respectively. Scale bars = 200 µm (A), 50 μm (B). (C, D) Sagittal sections of the ferret brain at P1 were subjected to Hoechst 33342 staining plus immunohistochemistry for HOPX (C) and Pax6 (D). Asterisks indicate prospective sulcal regions. Five regions (red boxes, #1–#5) based on the positions of prospective gyri and sulci in the upper panels are magnified in the lower panels. Black broken lines indicate the border between the VZ and the ISVZ. A, anterior; P, posterior.Scale bars = 1 mm (upper), 200 µm (lower). (E) Sections of the ferret cerebral cortex at P1 were subjected to immunohistochemistry for Pax6, HOPX and Tbr2. Magnified images of the OSVZ corresponding to regions #2 and #3 are shown. Arrowheads and open arrowheads indicate HOPX-positive and HOPX-negative oRG cells, respectively. Scale bar = 20 μm. (F) Ratios of cell numbers between prospective gyral and sulcal regions. Numbers of HOPX-positive oRG cells (HOPX+), HOPX-negative oRG cells (HOPX-), IP cells (Tbr2+), Pax6-positive cells and Tbr2-positive and/or Pax6-positive cells (All) in region #3 were divided by the corresponding numbers in region #2. The ratio would be one if the number of cells was the same between regions #3 and #2 (broken red line). n = 3 animals. Bars present mean ± SD. ns, not significant. *p<0.05, **p<0.01, Student's t-test. (G) Proportions of HOPX-positive oRG cells (green), HOPX-negative oRG cells (white) and IP cells (magenta) in regions #2 and #3. n = 3 animals. Bars present mean ± SD. *p<0.05, ***p<0.001, Student's t-test. (H) Sections of the ferret cerebral cortex at P1 were quadruple-stained with anti-HOPX, anti-Tbr2, anti-Pax6 and anti-Ki-67 antibodies. Arrowheads and open arrowheads indicate HOPX-positive oRG cells co-expressing Ki-67 and HOPX-negative oRG cells co-expressing Ki-67, respectively. Scale bar = 50 μm. (I) Percentages of HOPX-positive (HOPX+) and HOPX-negative (HOPX-) oRG cells co-expressing Ki-67 in the OSVZ. n = 3 animals. Bars present mean ± SD. ns, not significant. Student's t-test. (J) Newborn ferrets were intraperitoneally injected with EdU at P0 and analyzed 28 hr later. Sections were triple-stained with anti-HOPX, anti-Tbr2 and anti-Pax6 antibodies, and EdU was visualized.Arrowheads and open arrowheads indicate HOPX-positive and HOPX-negative oRG cells co-labeled with EdU, respectively. Scale bar = 50 μm. (K) Percentages of HOPX-positive (HOPX+) and HOPX-negative (HOPX-) oRG cells co-labeled with EdU in the OSVZ. n = 3 animals for each condition. Bars present mean ± SD. *p<0.05, Student's t-test. (L) Newborn ferrets were intraperitoneally injected with EdU at P0 and analyzed 28 hr later. Sections were triple-stained with anti-HOPX, anti-Pax6 and anti-Ki-67 antibodies, and EdU was visualized.Arrowhead indicates HOPX-positive oRG cells co-labeled with Ki-67 and EdU. Scale bar = 50 μm. (M) Percentages of HOPX-positive (HOPX+) and HOPX-negative (HOPX-) oRG cells co-labeled with Ki-67 and EdU in the OSVZ. n = 3 animals for each condition. Bars present mean ± SD. *p<0.05, Student's t-test.


