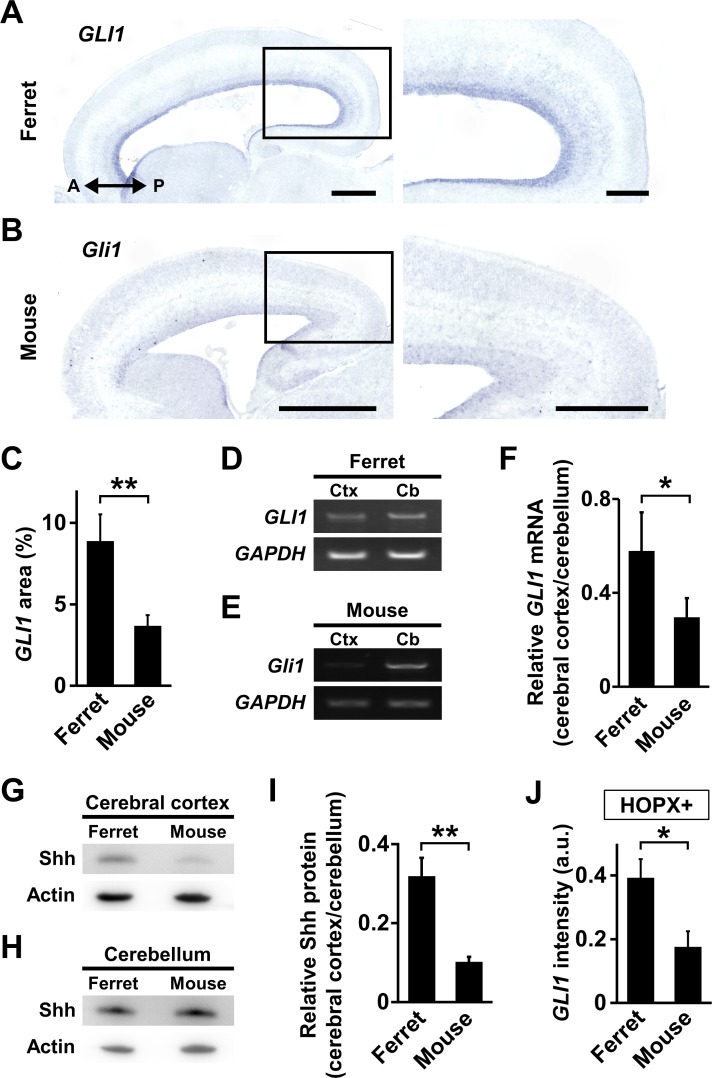
Figure 6. Shh signaling is more activated in the cerebral cortex of ferrets than that of mice.
(A, B) GLI1 expression in the developing ferret and mouse cerebral cortex. Sagittal sections of the ferret brain at P1 (A) and the mouse brain at E17 (B) were subjected to in situ hybridization for ferret GLI1 and mouse Gli1, respectively. The areas within the boxes in the left panels are magnified in the right panels. Scale bars = 1 mm (left), 500 μm (right). (C) Percentages of GLI1-positive areas in the germinal zones of ferret and mouse cerebral cortex. n = 3 animals. Bars present mean ± SD. **p<0.01, Student's t-test. .(D) RT-PCR for GLI1 and GAPDH in the cerebral cortex (Ctx) and the cerebellum (Cb) of ferrets at P1. (E) RT-PCR for Gli1 and GAPDH in the cerebral cortex (Ctx) and the cerebellum (Cb) of mice at E17. (F) Quantification of GLI1 mRNA levels in the cerebral cortex of mice and ferrets. GLI1 signal intensities from RT-PCR were measured, and GLI1 expression levels in the cerebral cortex were normalized with those in the cerebellum. n = 3 animals. Bars present mean ± SD.*p<0.05, Student's t-test. (G) Immunoblotting for Shh in the cerebral cortex of mice at E17 and ferrets at P1. (H) Immunoblotting for Shh in the cerebellum of mice at E17 and ferrets at P1. (I) Quantification of Shh protein levels in the cerebral cortex of mice and ferrets. Shh signal intensities on immunoblots were measured, and Shh signal intensities in the cerebral cortex were normalized with those in the cerebellum. n = 3 animals. Bars present mean ± SD.**p<0.01, Student's t-test. (J) Quantification of GLI1 signal intensity in each HOPX-positive cell in the germinal zone of the mouse and ferret cerebral cortex. Sagittal sections of the ferret brain at P1 and the mouse brain at E17 were subjected to in situ hybridization for ferret GLI1 and mouse Gli1, respectively, and to immunohistochemistry for HOPX. The average values of GLI1 and Gli1 signal intensities in the germinal zone were normalized with the corresponding values in the external granule layer of the cerebellum in the same sagittal sections. n = 3 animals for each condition. Bars present mean ± SEM.*p<0.05, Student's t-test. a.u., arbitrary units.

