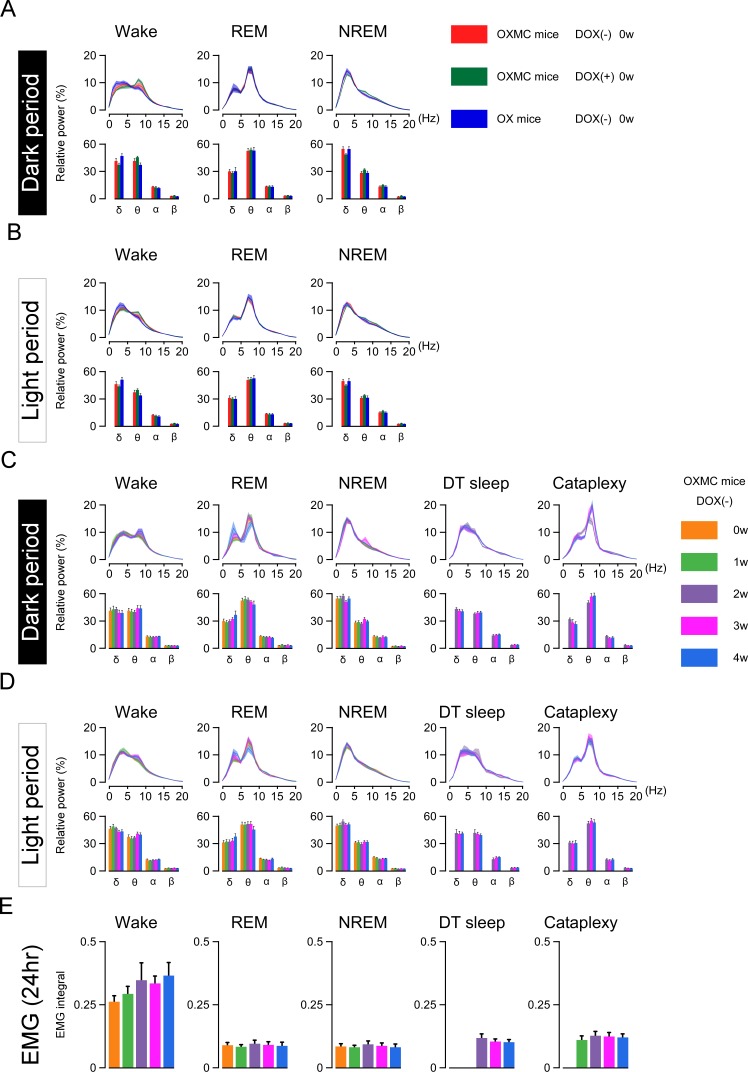
Figure 4. DOX removal from the diet in OXMC mice does not affect relative EEG power distribution or the EMG integral.
(A) Relative EEG power in three strains of mice in the DOX(+) condition (before DOX removal) during the dark phase. Upper graphs show relative EEG power at 1 Hz resolution; lower graphs present the standard EEG frequency bands. (B) As in (A) but for the light phase. (C) Relative EEG power of OXMC mice measured during the dark phase from 0 to 4 weeks in the DOX(-) condition. Upper graphs show relative EEG power at 1 Hz resolution; lower graphs present the standard EEG frequency bands. (D) As in (C) but for the light phase. (E) EMG integral of OXMC mice in the DOX (-) condition. n = 6–8, Values are mean ± SEM.

