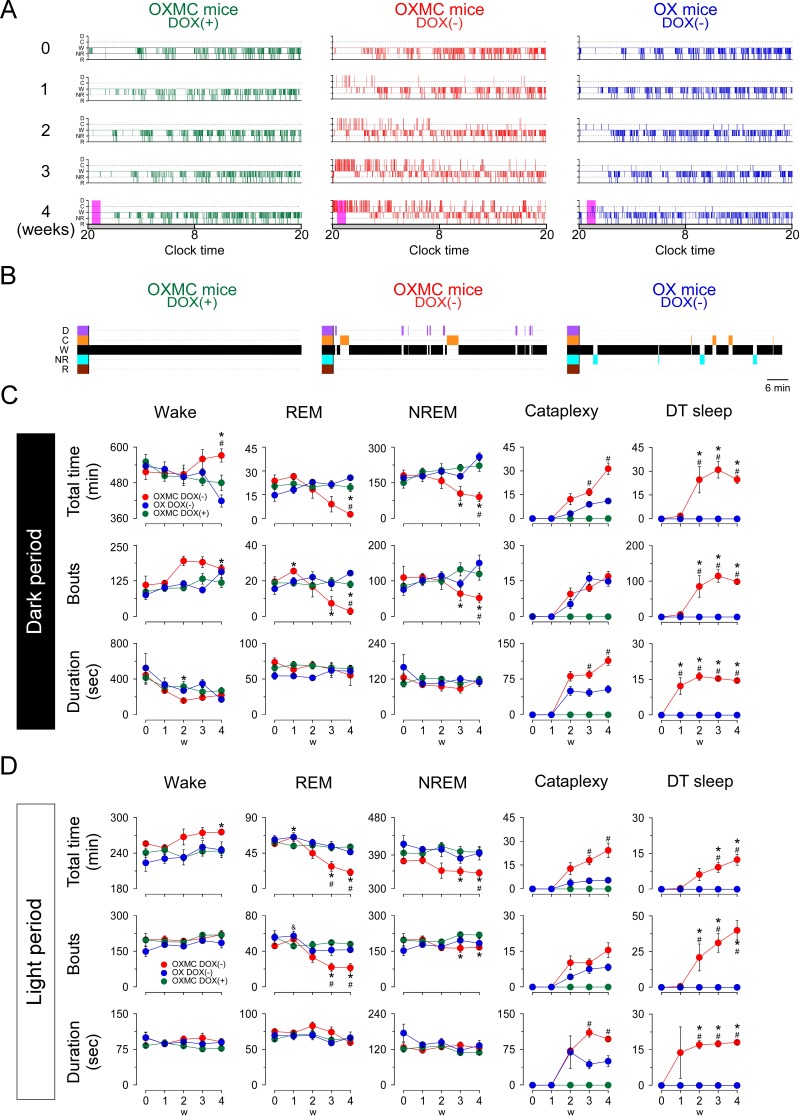
Figure 5. Effects of dual orexin- and MCH-neuron ablation on sleep/wake architecture in OXMC mice.
(A) Hypnograms from OXMC DOX(+), OXMC DOX(-) and OX DOX(-) mice before (0 week) and during dual orexin and MCH neuron ablation (1–4 weeks). Clock time and light-dark phase are shown below the hypnograms. D, DT sleep; C, cataplexy; W, wake; NR, NREM sleep; R, REM sleep. (B) Hypnograms for the 1 hr period after dark onset indicated by magenta rectangles in the 4 weeks hypnogram in A. (C) Total duration (upper panels), number of bouts (middle) and mean bout duration (lower panels) for wake, NREM, REM, cataplexy and DT sleep during the dark phase. (D) As in C but for the light phase. Values are means ± SEM. (OXMC DOX(+): (n = 7), OXMC DOX(-): (n = 8), OX DOX(-): (n = 4)). *p<0.05 vs OXMC DOX(+). #p<0.05 vs OX DOX(-). Data were analyzed by one-way ANOVA followed by the Bonferroni post hoc test.

