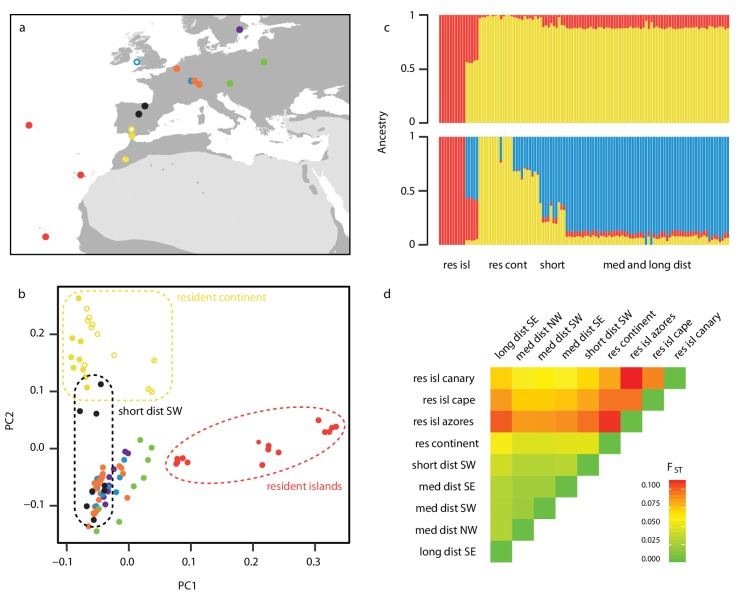
Figure 1. Sampling design and population structure.
(a) Sampling sites and migratory phenotypes. Samples were collected from the breeding grounds, except for a subset of NW migrants that were sampled during winter in the UK (open blue circle) (details in Supplementary file 4). (b–d) Population structure represented by a Principle Component Analysis (PCA) (b), NGSadmix (K = 2 and 3 shown) (c) and pairwise estimates of FST(d), showing differentiation between migrants and residents (as well as among residents themselves). Long dist SE = long distance migrants that orient SE in autumn (purple), med dist = medium distance migrants that orient in the corresponding heading during autumn migration (SE = green, SW = orange and NW = blue), res continent = residents found on the continent (yellow), short dist SW = short distance migrants that orient SW (black), res isl = resident birds on islands (cape = Cape Verde, canary = Canary Islands). Among continental residents, open circles indicate Cazalla de la Sierra, open circles with dash Asni, and filled circles Gibraltar. A PCA excluding islands can be found in Figure 1—figure supplement 1; results from NGSadmix at larger values of K can be found in Figure 1—figure supplement 2.
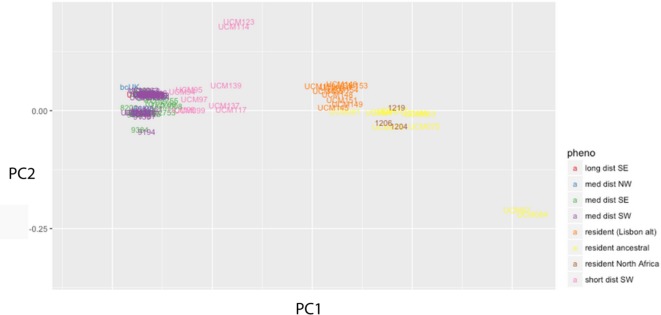
Figure 1—figure supplement 1. Principal component analysis matching that in Figure 1 but excluding island populations.
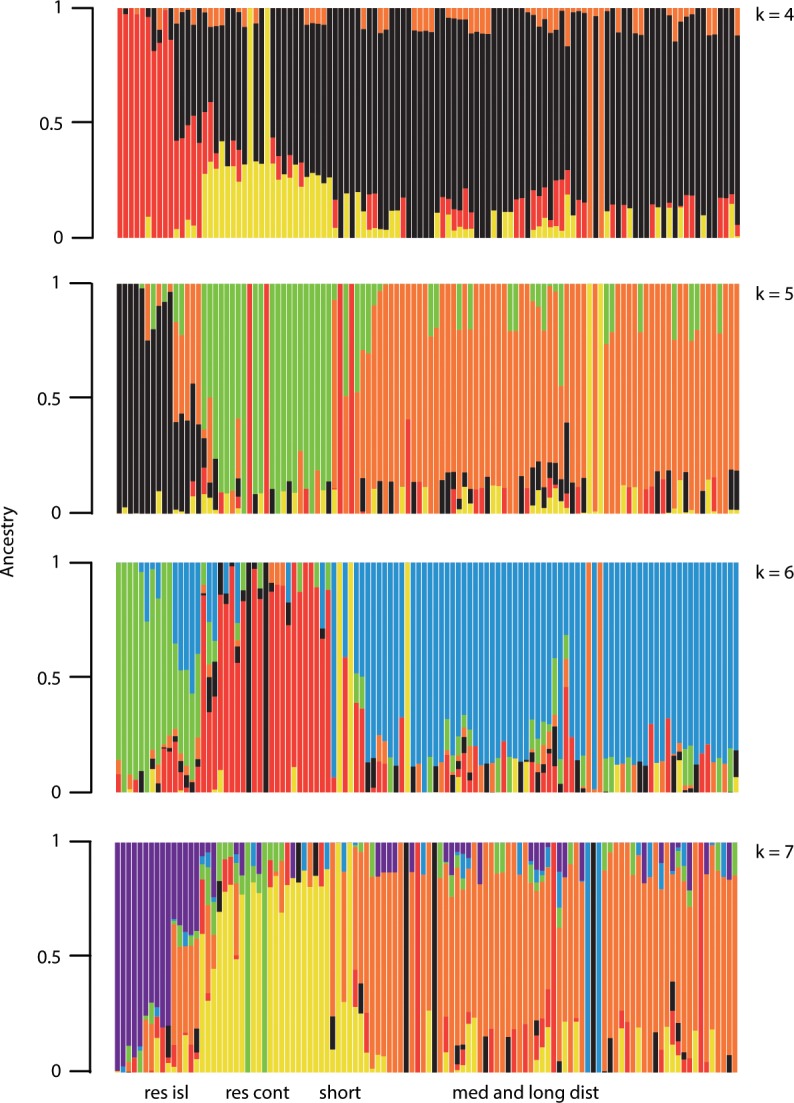
Figure 1—figure supplement 2. Complimentary figure to Figure 1c, showing ancestry proportions estimated by ADMIXTURE at larger cluster values (k = 4 through 7).


