. 2020 Apr 21;9:e54462. doi: 10.7554/eLife.54462

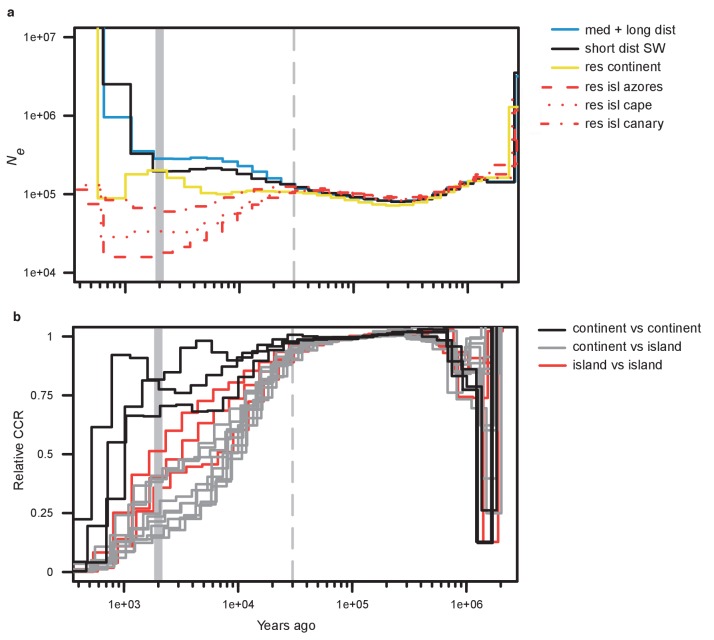
Figure 2. Demographic history.

(a) Effective population size by time estimated by MSMC2 using five individuals per blackcap phenotype. Note that the most recent time segment is regarded as being unreliable in MSMC2 results. (b) Relative cross-coalescence rate estimated by MSMC2. 15 lines with three colours indicate relative cross-coalescence rate for all pairwise combinations of the six populations (three for comparisons between populations on the continent [continent vs. continent], three for comparisons between populations on the islands [island vs. island], and nine for comparisons between continent and island populations [continent vs. island]). The dotted vertical line indicates the inferred time of population separation. Results from down-sampling can be found in Figure 2—figure supplements 1, 2 and 3; results for medium- and long-distance migrants run separately can be found in Figure 2—figure supplements 45 and 6.

Figure 2.

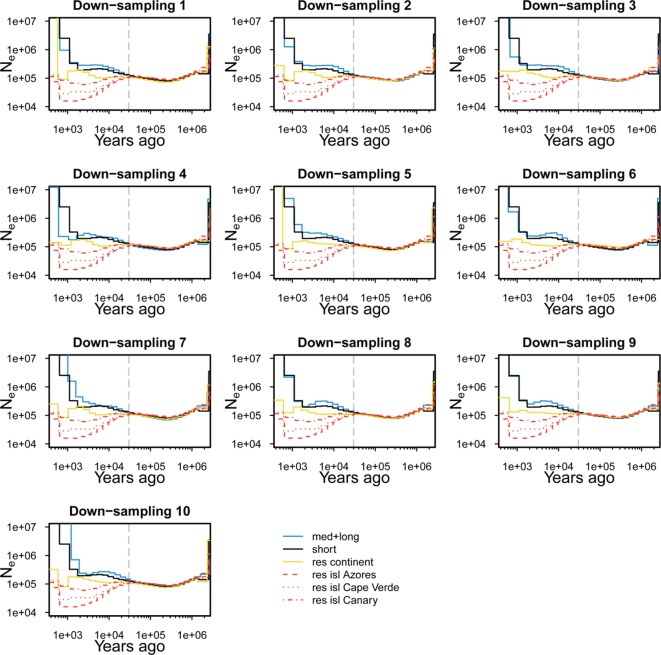
Figure 2—figure supplement 1. Down-sampling for demography analysis of effective population size.

Figure 2—figure supplement 1.

Ten selections each containing five individuals were randomly sampled from the 44 med+long migrants and from the 19 continental residents (down-sampling 1 to 10). These selections were used for 10 runs of demography analysis with MSMC2. Because there were only five individuals for each of the other four groups (short, Azores, Cape Verde, and Azores), the same sample sets were used for all 10 runs of the demography analysis. The results of the 10 runs of demography analysis are shown separately. Note that demography estimates of three island populations (red) and short migrants (black) are same across the 10 panels.
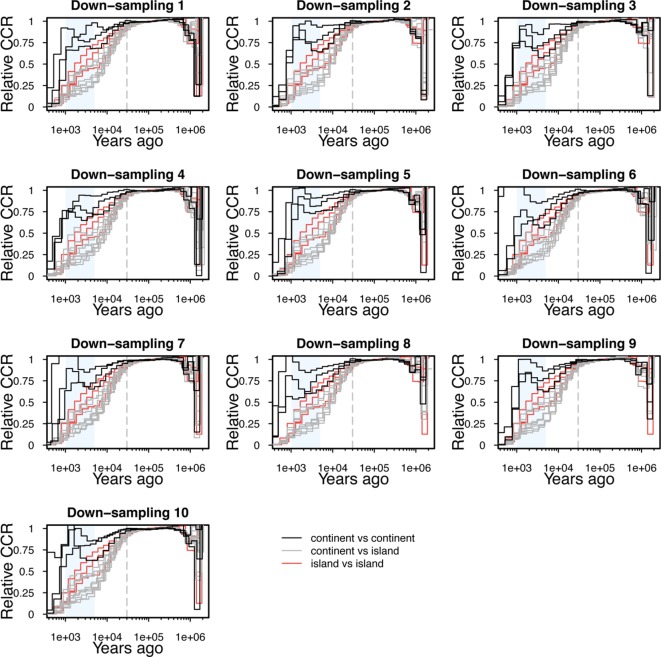
Figure 2—figure supplement 2. Down-sampling for demography analysis of relative cross-coalescence rate.

Figure 2—figure supplement 2.

The same down-sampled individuals as those taken for effective population size analysis (Figure 2—figure supplement 1) were also used for down-sampling of relative cross-coalescence rate analysis. Although the exact inferences of relative cross-coalescence rate especially between two continental groups (continent vs continent, black) are variable across down-samplings, the general pattern of steeper decline of relative cross-coalescence rate between continental and island groups (continent vs island, grey) than that between continent vs continent is consistent across all 10 down-samplings. Note that some inferences (three of continent vs island and three (all) of island vs island) are same across the 10 down-samplings because the both two phenotypes had only five individuals (see Figure 2—figure supplement 3 ).
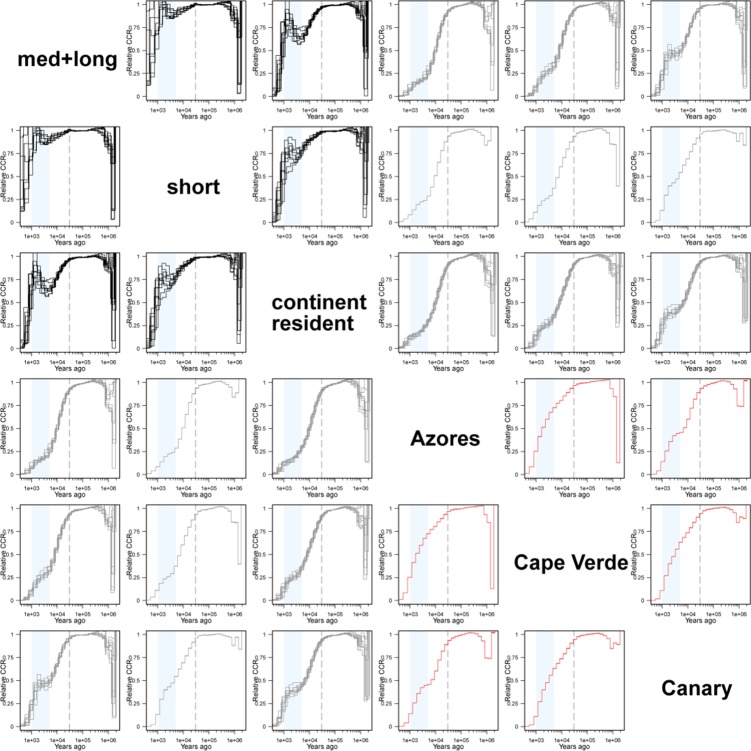
Figure 2—figure supplement 3. Demography analysis of relative cross-coalescence rate.

Figure 2—figure supplement 3.

Relative cross-coalescence rate of all 15 possible combinations of six groups are shown. Each line represents the relative cross-coalescence rate inference of one down-sampling (five individuals per group). The three line colours correspond to those in Figure 2b and Figure 2—figure supplement 2. Relative cross-coalescence rate started to increase ~5000 years ago between med+long and continental resident populations (shaded with light blue). Note that there is only one inference for short vs islands (Azores, Cape Verde, Canary) and island vs island (Azores vs Cape Verde, Cape Verde vs Canary, Canary vs Azores) because there are only five individuals for these phenotypes. Also note that the top and bottom diagonals are identical.
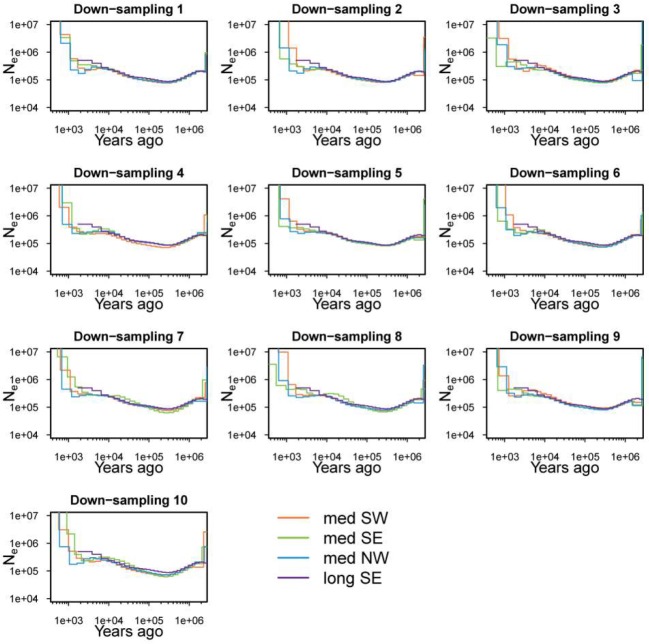
Figure 2—figure supplement 4. Medium distance NW, SW and SE migrants and long distance migrants show similar demographic histories.

Figure 2—figure supplement 4.

Effective population sizes show the same demographic trajectories. Five individuals were randomly sampled from each medium distance phenotype 10 times (down-sampling 1 to 10), and used for 10 runs of demography analysis with MSMC2. The results of the 10 runs are shown separately. Down-sampling was not done for long distance migrants as only two individuals met the coverage cutoff to be included in the analysis.
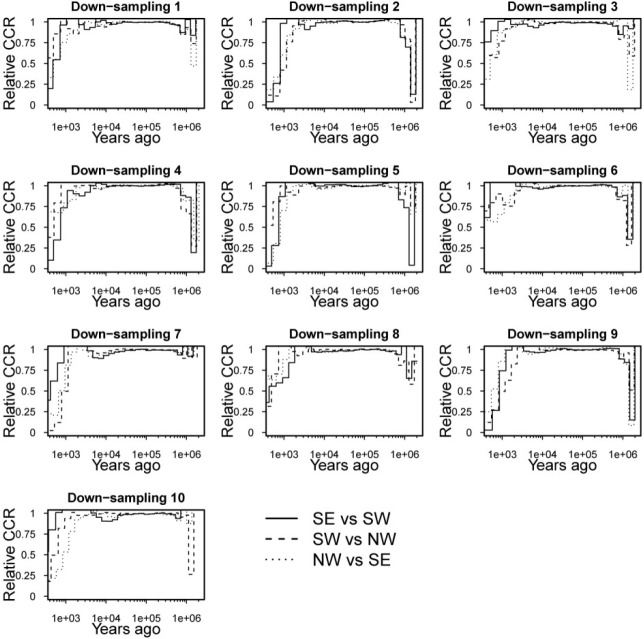
Figure 2—figure supplement 5. Medium distance NW, SW and SE migrants show similar demographic histories.

Figure 2—figure supplement 5.

Relative cross-coalescence rates stay high in all three pairwise comparisons between medium distance migrants, suggesting no clear population split among medium distance migrants with different orientation.
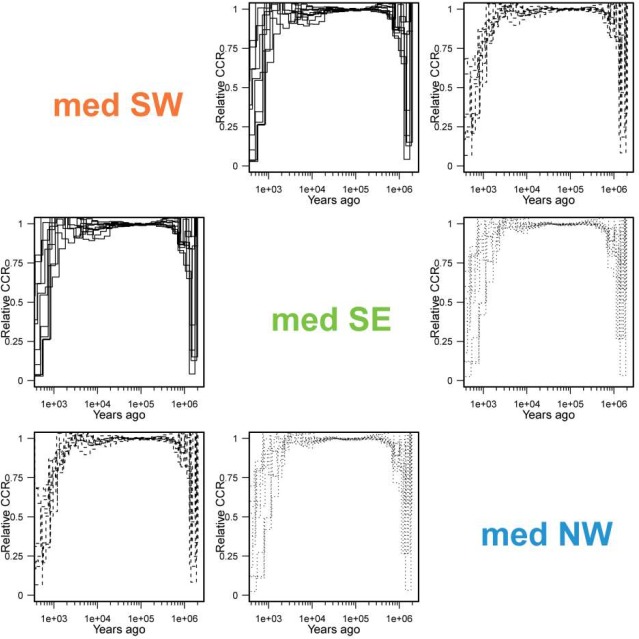
Figure 2—figure supplement 6. Medium distance NW, SW and SE migrants show similar demographic histories.

Figure 2—figure supplement 6.

Relative cross-coalescence rates stay high in all three pairwise comparisons between medium distance migrants, suggesting no clear population split among medium distance migrants with different orientation. Note that the top and bottom diagonals are identical.