. 2020 Apr 21;9:e52701. doi: 10.7554/eLife.52701

Figure 6. Both dsx and fru specify the sexual dimorphism of P1a neurons.

(A–D) Expression of CsChrimson:tdTomato under the control of P1a-GAL4 (red in A1–D1, black in A2,3-D2,3) in brains of a male (A), fruM female (B), fruF male (C), and female (D) is visualized together with a neuropil marker BRP (blue) by immunohistochemistry. Circle: soma (right cluster is enlarged in A3 and C3), red asterisk: sex-invariant background labeling (see Materials and methods for details). Scale bar: 100 μm (A1–D1), 10 μm (A3, C3). (E) Mean number of cell bodies per hemibrain visualized by anti-DsRed antibody in each genotype represented in A–D) and Figure 6—figure supplement 1A–D. (F, G) Z-projection of the registered and averaged images of CsChrimson:tdTomato expression under the control of P1a-GAL4 in male (F) and fruF male (G). A part of the standard Drosophila brain is shown in gray in F2, G2. Number of hemibrains used are indicated in F2) and G2). Lateral junction (cyan) and dorsal posterior projection (yellow) are segmented and overlaid in F2) and G2. H, I. Boxplot of volumes of lateral junction (H) and dorsal posterior projection (I). Genotypes and number of hemibrains are indicated below the plot. **p<0.01, n.s. p>0.05 (Kruskal-Wallis one-way ANOVA and post-hoc Mann-Whitney U-test).

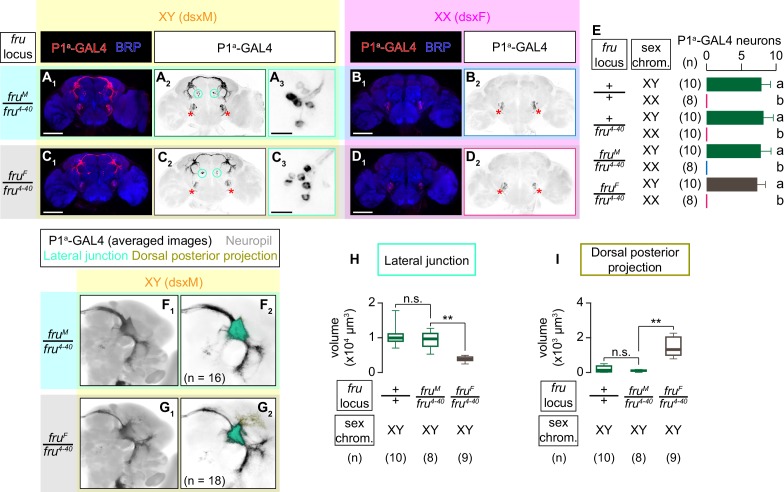
Figure 6.

Figure 6—figure supplement 1. Heterozygosity of the fru4-40 allele leaves the neuroanatomy and function of P1a neurons largely unaltered.

Figure 6—figure supplement 1.

(A–D) Expression of CsChrimson:tdTomato under the control of P1a (red in A1–D1), black in A2,3-D2,3) in representative brains of a fru wild-type male (A), fru wild-type female (B), fru4-40 heterozygous male (C), and fru4-40 heterozygous female (D), is visualized together with a neuropil marker BRP (blue in A1–D1) by immunohistochemistry. Scale bar: 100 μm. Circle: soma, red asterisk: sex-invariant background labeling.( E, F) Z-projection of the registered and averaged images of CsChrimson:tdTomato expression under the control of P1a in fru wild-type male (E) duplication from Figure 5E) and fruM/fru4-40 male (F); duplication from Figure 6F). Number of used hemibrains are indicated. (G) Boxplots of time orienting (G1), lunges (G2), and wing extensions (G3) performed by male tester flies that express CsChrimson:tdTomato under the control of P1a. Only values during the time window four are shown (see Figure 1D). Testers’ fru locus genotypes and pair numbers are indicated below the plots. Target flies are either group-housed wild-type males or mated females, as indicated. Plots with gray shades are replots of the data sets shown in Figure 5—figure supplement 1A,B. **p<0.01, n.s. p>0.05 (Kruskal-Wallis one-way ANOVA and post-hoc Mann-Whitney U-test).
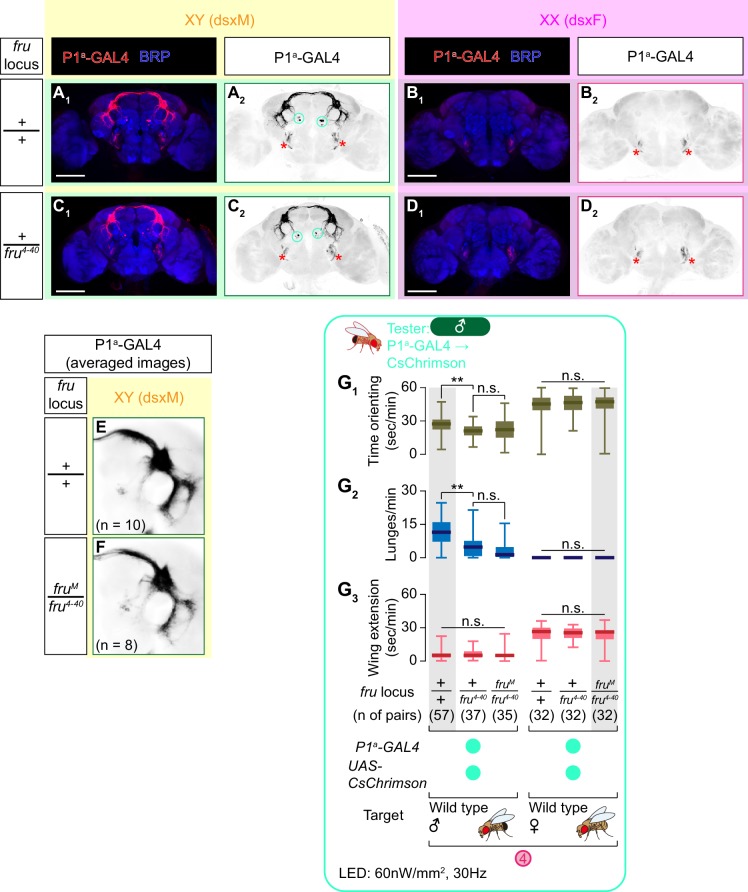
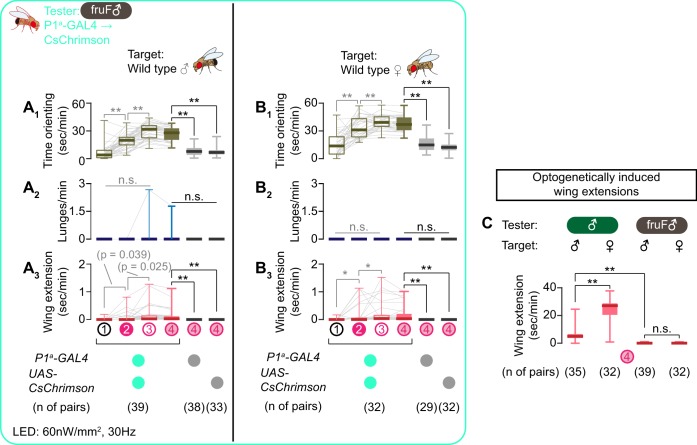
Figure 6—figure supplement 2. P1a neurons in fruF males are defective in promoting both courtship and aggressive behavior.

Figure 6—figure supplement 2.

(A, B) Boxplots of time orienting (A1, B1), lunges (A2, B2), and wing extension (A3, B3) by the tester flies during the time windows 1–4 (see Figure 1D). Their genotypes and numbers are indicated below the plots. Gray lines represent single testers. Target flies are either group-housed wild-type males (A) or mated females (B). In gray: **p<0.01, *p<0.05, n.s. p>0.05 (Kruskal-Wallis one-way ANOVA and post-hoc Wilcoxon signed rank test). In black: **p<0.01, n.s. p>0.05 (Kruskal-Wallis one-way ANOVA and post-hoc Mann-Whitney U-test). (C) Comparison of wing extension performed by flies that express CsChrimson:tdTomato under the control of P1a in males (data from Figure 6—figure supplement 1G) or in fruF males (data from A, (B), during the time window 4. Sex of tester and target flies is indicated above the panels. Number of pairs tested is indicated below the panels. **p<0.01, n.s. p>0.05 (Mann-Whitney U-test).