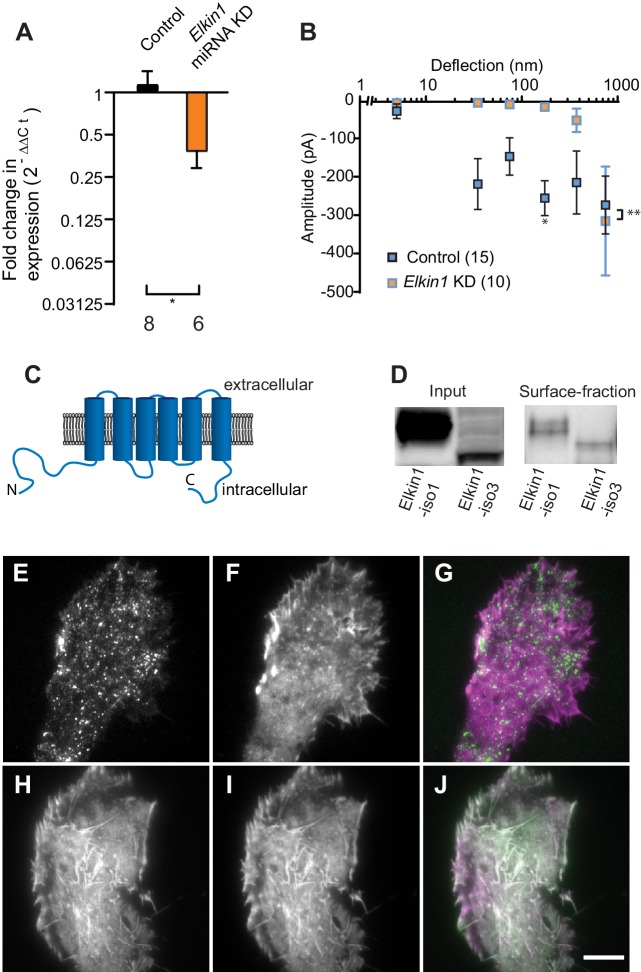
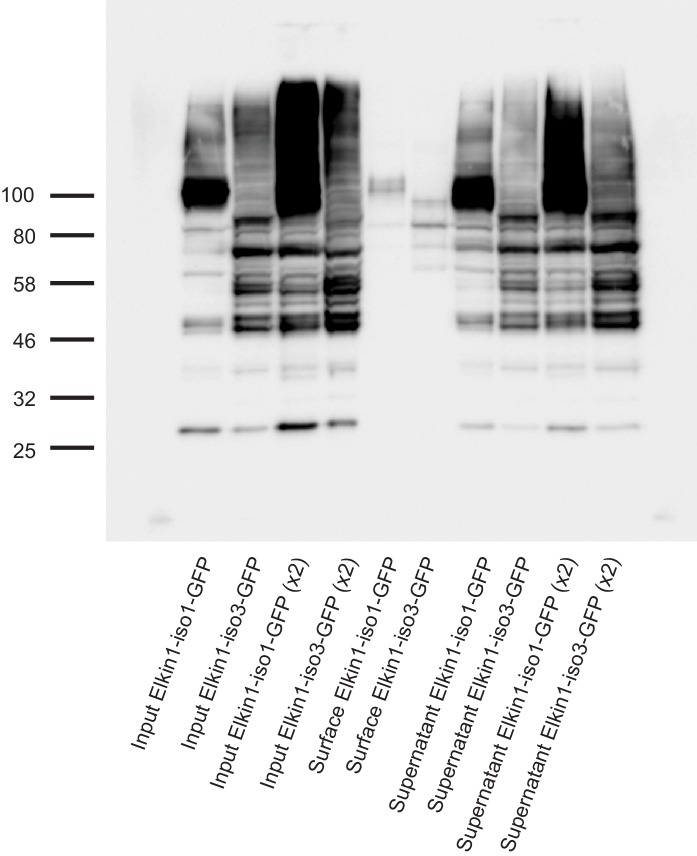
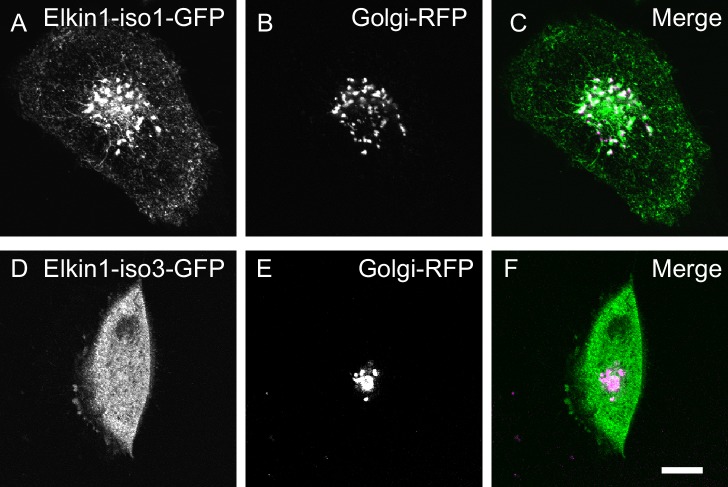
Figure 2. TMEM87a/Elkin1 in WM266-4 cells.
(A) Transfection of WM266-4 cells with a plasmid encoding miRNA targeting Elkin1 leads to a reduction in Elkin1 transcript (Mann-Whitney, control n = 8, KD n = 6, *p=0.013). (B) Knockdown of Elkin1 leads to a significant decrease in MA currents in WM266-4 cells, in comparison with controls (two-way ANOVA, control n = 15, Elkin1 KD = 10, **p=0.004; Sidak’s multiple comparison, *p=0.02) (data presented as mean ± s.e.m.). (C) Transmembrane topology prediction of hsElkin1-iso1, with 6 TM domains (highest probability prediction of TM domains). (D) Western-blot analysis of samples prepared from HEK-293T cells overexpressing hsElkin1-isoform1 or hsElkin1-isoform3. The surface fraction was isolated by pull-down of biotinylated proteins after surface labelling. Note, both hsElkin1-isoform1 and hsElkin1-isoform3 are present at the cell surface. See Figure 2—figure supplement 1 for full blot. TIRF images of (E) hsElkin1-iso1-GFP, (F) Lifeact mCherry and (G) overlay in WM266-4 cells. Note that hsElkin1-iso1 is present in foci as well as the plasma membrane. TIRF images of (H) hsElkin1-iso3-GFP, (I) Lifeact mCherry and (J) overlay in WM266-4 cells. Note that hsElkin1-iso3 is present in the plasma membrane and associated with actin structures. Scale bar 10 µm. See Figure 2—videos 1 and 2 for corresponding live-cell imaging and Figure 2—figure supplement 2 for laser scanning confocal imaging of hsElkin1-iso1/hsElkin1-iso3 with a Golgi-RFP marker.


