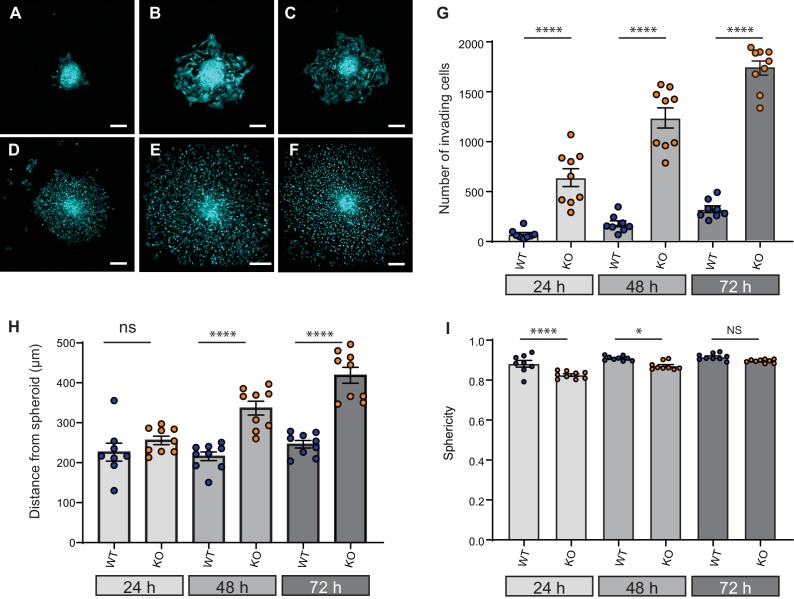
Figure 7. Elkin1-KO increases cell dissociation from organotypic spheroids.
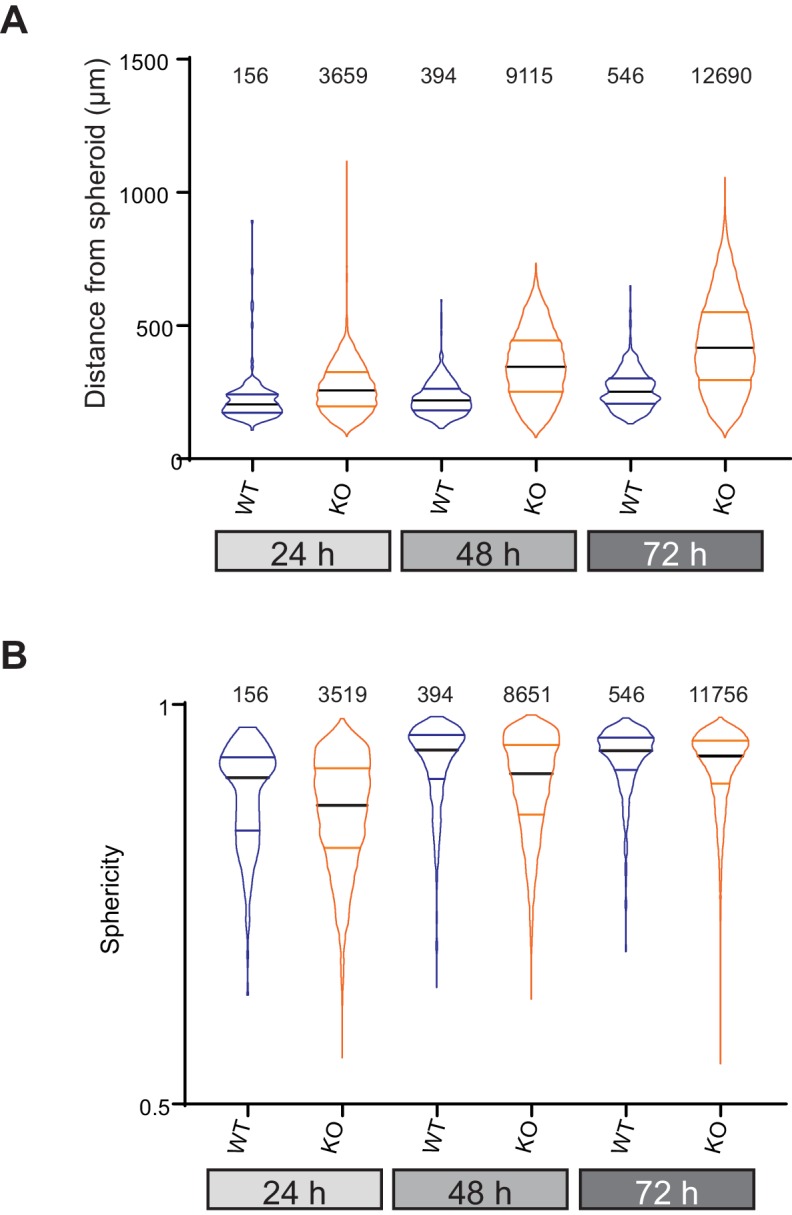
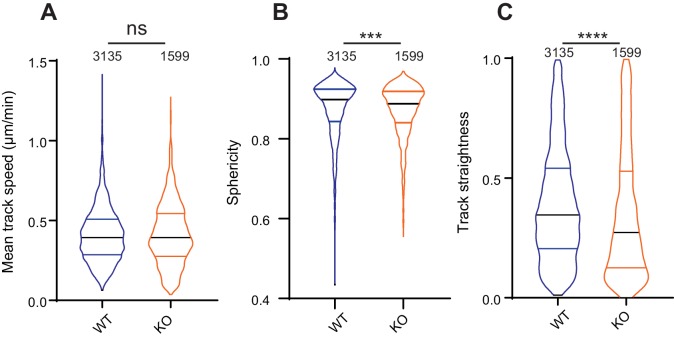
(A–C) Representative images of WT spheroids at 24 (A), 48 (B) and 72 (C) h post-implantation in 3D collagen I gel. See Figure 7—videos 1 and 2 for live imaging of 0–12 hr post-implantation. (D–F) Representative images of Elkin1-KO spheroids at 24 (D), 48 (E), and 72 hr (F). Scale bars = 200 µm. (G) At all time points the number of Elkin1-KO cells that had dissociated from the spheroid was higher than for the WT cells. Data is presented as the mean ± s.e.m. with individual points representing the average number of invading cells for each spheroid (one-way ANOVA with Tukey’s multiple comparison, WT = 9, Elkin1-KO = 9, 24, 48, 72 hr ****p=0.0001). (H) Average distance of cells from the edge of the spheroid. Data are presented as mean ± s.e.m. of distance from spheroid with overlay of points representing the average for each individual experiment The average distance per spheroid was significantly different at 48 and 72 hr, but not 24 hr (one-way ANOVA with Tukey’s multiple comparison: WT = 9 spheroids, Elkin1-KO = 9 spheroids, 24 h p=0.78; 48 hr, ****p<0.0001; 72 hr, ****p<0.0001). See Figure 7—figure supplement 1A for data representing all individual cells. (I) Sphericity of cells that had invaded the collagen gel. Data are average sphericity of all cells within the collagen gel at each time point, presented as bar graphs with mean ± s.e.m. with an overlay of average for each spheroid measured. The WT cells were significantly more spherical than the Elkin1-KO clones at 24 and 48 hr (one-way ANOVA with Tukey’s multiple comparison, WT = 9 spheroids, Elkin1-KO = 9 spheroids, 24 hr, ****p<0.0001; 48 hr, *p=0.012; 72 hr, NS, p=0.46). See Figure 7—figure supplement 1B for data representing all individual cells, Figure 7—figure supplement 2 for migration data corresponding to isolated cells in 3D collagen gels and Figure 7—source data 1 for further details.
Figure 7—figure supplement 1. Data from all individual cells invading collagen gels from organotypic spheroids.


