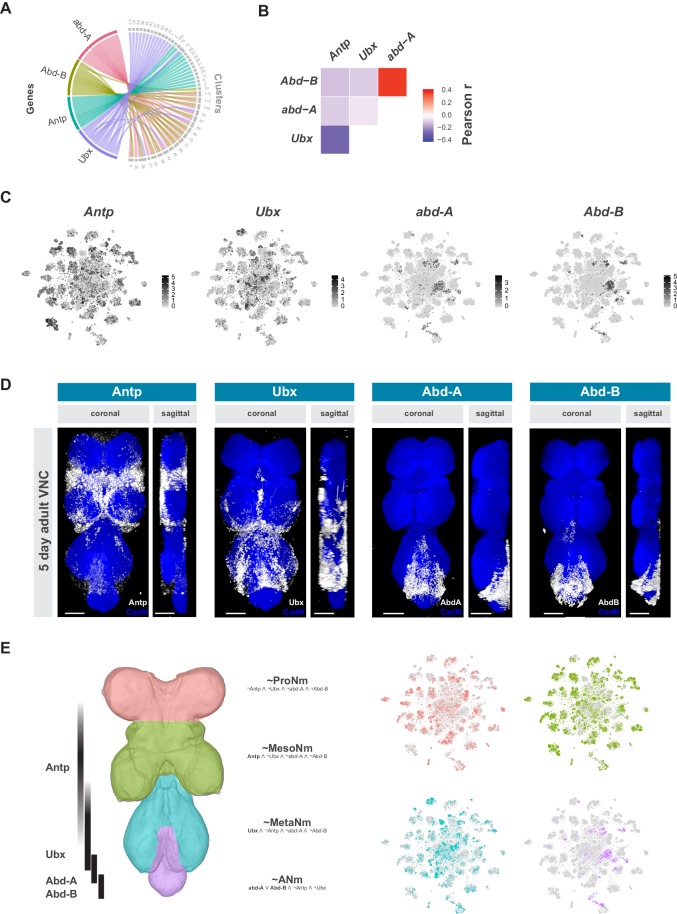
Figure 3. Neuromeres are defined by Hox gene expression in the adult VNC.
(A) Chord diagram comparing the relationship between Hox genes found as cluster markers (left) and the clusters in which they are significantly enriched (right), based on data available in Figure 1—source data 1. (B) Heatmap of Pearson correlation coefficient for Hox gene expression in all single cells. We saw consistent patterns of correlation at the cluster-level expression, and between replicates. (C) t-SNE plot of Hox gene expression distribution. Expression shown in black, intensity is proportional to the log-normalized expression levels. (D) Visualization of Hox protein expression in the 5 day old adult VNC. Coronal and sagittal views of anti-Antp, -Ubx, -Abd-A, and -Abd-B (white). Neuropil counterstained with anti-Cad-N (blue). Scale bars = 50 μm. (E) Schematic representing bands of Hox expression along the anterior-posterior axis of the VNC (left). Cells assigned to approximate neuromeres in VNC t-SNE plots (right) based on differential Hox gene expression: ProNm (pink), MesoNm (green), MetaNm (blue) and ANm (purple). Expressed genes used in defining each neuromere are in bold. (symbols represent the following: ‘¬’ not, ‘∧’ and, ‘∨’ or, ‘~’ approximate).

