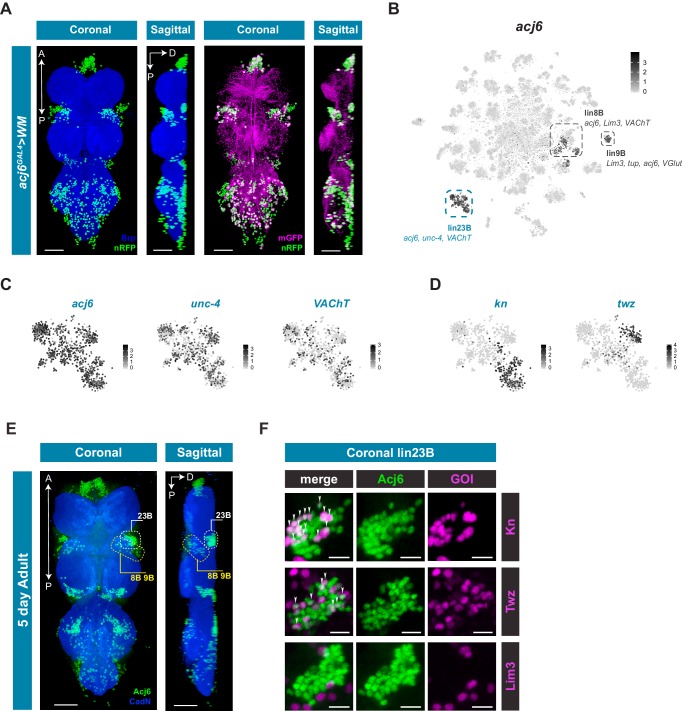
Figure 5. acj6 expression, hemilineage identity, and novel sub-lineage marker co-expression in the VNC.
(A) Visualization of acj6 expressing cells in the 5 day old adult VNC. Maximal coronal projection, and hemi-maximal sagittal projectionof acj6GAL4 driving expression of UAS-WM, enabling the visualization of cell nuclei (nRFP; green) and neuronal morphology (mGFP; magenta). Neuropil is counterstained (Brp; blue). A, Anterior, P, posterior, D, dorsal; scale bars = 50 μm. (B) t-SNE plot of acj6 expression in the VNC. Predicted hemilineage 8B, 9B, and 23B, based on known markers (shown below) are highlighted. (C) t-SNE plots of predicted hemilineage 23B, showing expression of markers acj6, unc-4, and VAChT. (D) t-SNE plots of predicted hemilineage 23B, showing expression of novel sub-type markers kn and twz. (B–D) Expression shown in black, intensity is proportional to the log-normalized expression levels. (E) Maximal coronal view (left) and hemi-maximal sagittal view (right) of Acj6 expression (green) in the 5 day old adult VNC. The posterior prothoracic hemilineages 23B (dashed white box) and the anterior mesothoracic 8B and 9B (dashed yellow box) are marked. A, Anterior, P, posterior, D, dorsal; Neuropil is counterstained (Cad-N; blue) scale bars = 50 μm. (F) Close-up maximal coronal views of dorsolateral hemilineage 23B showing the co-expression of knGAL4 and twzGAL4 driven UAS-Stinger expression (nGFP; magenta) with Acj6 (green). Co-positive cells (white) are indicated with arrow heads. Lim3GAL4 driven expression did not colocalize with Acj6 in hemilineage 23B. GOI = gene of interest, scale bars = 10 μm.


