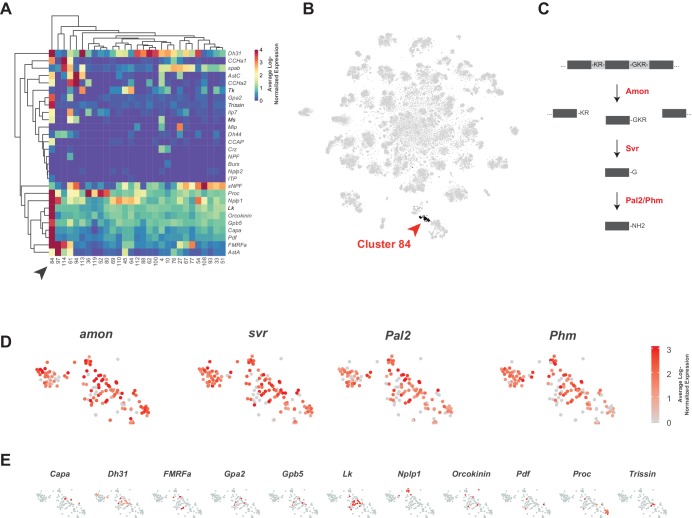
Figure 8. Identification of neuropeptide expressing cells.
(A) Heatmap of the mean log-normalized expression (0–4), by cluster (bottom), of neuropeptide genes (right). Only clusters with at least one neuropeptide gene expressing in excess of mean log-normalized value of 10 are shown. Only neuropeptide genes that were expressed in at least one cell at a level >10 transcripts per cell are shown. Arrowhead highlights cluster 84. Dendrograms represent hierarchical clustering. (B) t-SNE plot highlighting neuropeptide expressing cluster 84. (C) Schematic of neuropeptide processing steps highlighting enzymes (in red) identified as enriched markers for cluster 84. Propeptides are cleaved by the pro-hormone convertase Amontillado (Amon); the carboxypeptidase Silver (Svr) then removes the C-terminal cleavage sequence. C-terminal amidation occurs through the combined actions of Peptidyl-α-hydroxyglycine-α-amidating lyase 2 (Pal2) and Peptidylglycin-α-hydroxylating monooxygenase (Phm) (reviewed in Pauls et al., 2014). (D, E). Expression of neuropeptide processing enzymes (D) and multiple neuropeptide genes (E) in t-SNE cluster 84. Intensity of red is proportional to the log-normalized expression level.


