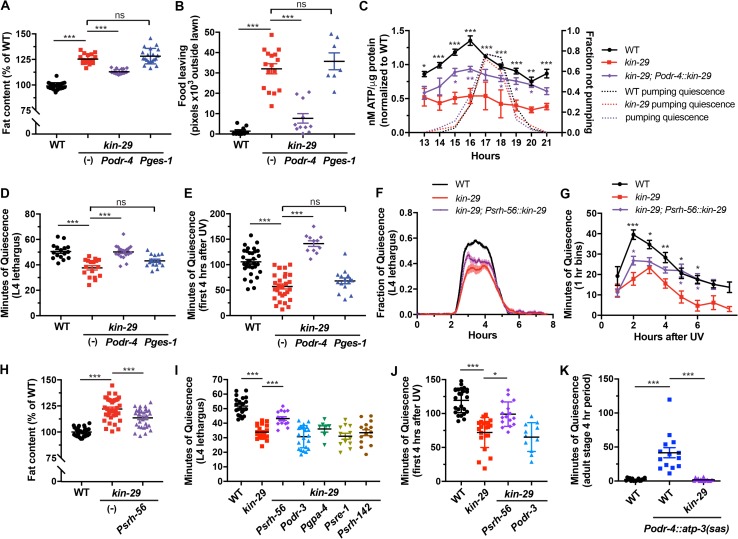
Fig 5. kin-29 acts in a subset of sensory neurons to regulate DTS and SIS sleep, fat stores, and food-leaving behavior.
(A and B) Expression of kin-29 in sensory neurons but not in the gut corrects the increased fat content (A) and increased food-leaving behavioral (B) phenotypes of kin-29 null mutants. odr-4 is expressed in 12 pairs of sensory neurons. ges-1 is expressed in the intestine. Fat content was measured with fixative Nile Red staining, and data are represented as a percentage of total body fat in WT controls ± SEM (n = 18–24 animals). Food leaving was quantified as the area of exploration with each data point representing tracks from a population outside the bacterial lawn. Each data point represents the total number of pixels outside of the bacterial lawn of 7 animals per plate, and the horizontal lines represent the mean ± SEM of individual experiments. *** indicates values that are different from WT and nontransgenic (-) kin-29 animals at p < 0.001 by an ANOVA with Tukey multiple-comparisons test (S1 Data, Sheet 5A and 5B). (C) Total body ATP per μg protein measured before, during, and after L1 lethargus/DTS of the indicated genotypes. kin-29 animals expressing Podr-4::kin-29 partially restore the reduced ATP levels of kin-29 mutants. Podr-4::kin-29 is an extrachromosomal transgenic array, and about 20% of siblings of this strain that have lost the array (and are therefore kin-29 mutants) are included in the ATP measurements, thereby reducing the overall ATP levels. Data are normalized to the average value of the WT time course. The second y-axis shows the averaged fraction of nonpumping animals (n = 10) for each genotype and time point. Graphs show the mean ± SEM of 7 experiments for WT, 2 experiments for kin-29 mutants, and 3 experiments for Podr-4::kin-29. Statistical comparisons were performed with a 2-way ANOVA using time and genotype as factors, followed by post hoc pairwise comparisons at each time point to obtain nominal p-values, which were subjected to a Bonferroni correction for multiple comparisons. ** and * indicate corrected p-values that are significantly different between kin-29 mutants and kin-29 animals carrying the Podr-4::kin-29 transgene at p < 0.01 and p < 0.05, respectively (S1 Data, Sheet 5C). (D and E) The reduced body movement quiescence of kin-29 null mutants during L4 lethargus/DTS (D) and after UV exposure/SIS (E) is restored by expressing kin-29 in odr-4(+) sensory neurons, but not in the ges-1(+) intestinal cells (n > 15 animals per group). Nontransgenic (-) kin-29-mutant animals are shown. Data are represented as the mean ± SEM. *** indicates values that are different from WT and nontransgenic (-) kin-29 animals at p < 0.001 by an ANOVA with Tukey multiple-comparisons test (S1 Data, Sheet 5D and 5E). (F and G) Reduced movement quiescence of kin-29 null mutants during L4 lethargus/DTS (F) and after UV exposure/SIS (G) is partially restored by expressing kin-29 in srh-56-expressed neurons (ASH, ASJ, ASK). (F) The fraction of quiescence in a 10-min moving window (n = 9–11 animals for each trace). The x-axis represents hours from the start of recording in the late L4 stage. The data from individual worms were aligned such that the start of lethargus quiescence occurred simultaneously. Shading indicates SEM. (G) Mean ± SEM of body movement quiescence per hour after UVC irradiation (1,500 J/m2) (n = 8–10 animals for each genotype). Statistical comparisons were performed by an unpaired multiple-comparison t test with Holm-Sidak correction. ***, **, and * indicate corrected p-values that are different from kin-29 mutants at p < 0.001, p < 0.01, and p < 0.05, respectively (S1 Data, Sheet 5F and 5G). (H) Fat content measured with fixative Oil Red O staining. Data are represented as a percentage of total body fat in WT controls ± SEM (n = 28–36 animals for each genotype). *** and * indicate values that are different from WT and nontransgenic (-) kin-29 animals at p < 0.001 by an ANOVA with Tukey multiple-comparisons test (S1 Data, Sheet 5H). (I and J) Minutes of body movement quiescence during L4 lethargus/DTS (I) and after UVC exposure (J) in WT animals, kin-29 null mutant animals, and kin-29 mutants carrying transgenes encoding kin-29 under the control of the indicated promoters (n > 7 animals for each genotype). Data are represented as the mean ± SEM. *** and * indicate corrected p-values at p < 0.001 and p < 0.05, respectively, by an ANOVA with Tukey multiple-comparisons test (I), and Kruskal-Wallis with Dunn multiple-comparisons test (J) (S1 Data, Sheet 5I and 5J). (K) Minutes of body movement quiescence of Podr-4::atp-3(sas) adult transgenic animals during 4 hr (n = 14–16 for each genotype). Data are represented as the mean ± SEM. *** indicate corrected p-values that are different from WT or kin-29 mutants at p < 0.001 by a Kruskal-Wallis with Dunn multiple-comparisons test (S1 Data, Sheet 5K). DTS, developmentally timed sleep; ges-1, gut esterase 1; L1, first larval stage; L4 stage, fourth larval stage; ns, not significant; SIS, stress-induced sleep; UVC, ultraviolet C; WT, wild type.

