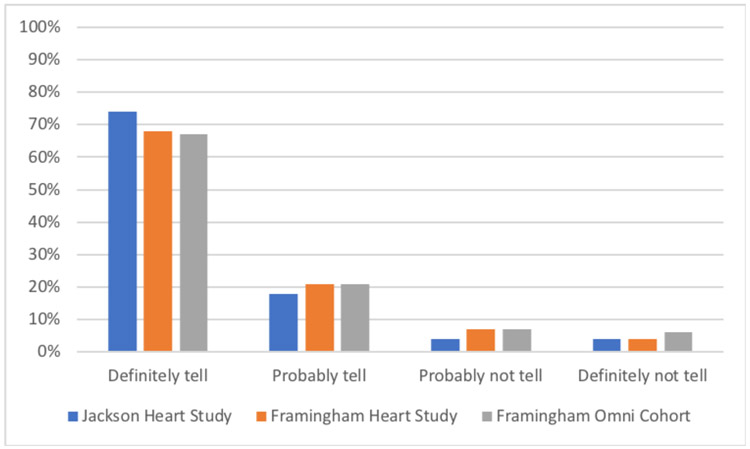
Figure 1.
Responses to factorial vignettes. Bars represent the proportions of respondents who said they would definitely, probably, probably not, or definitely not want to be told about their genetic risk across all 64 factorial vignette combinations. The data represent 2736 responses from 942 unique JHS respondents, 2773 responses from 941 unique FHS respondents, and 471 responses from 159 unique FHS Omni Cohort respondents.

