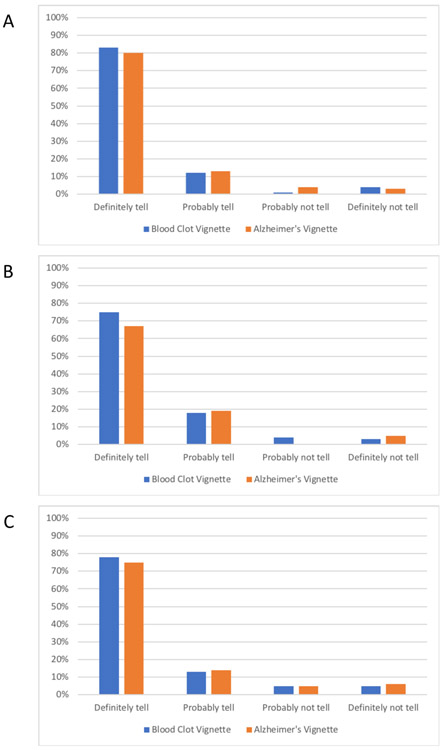
Figure 2.
Responses to blood clot risk and early Alzheimer’s disease risk vignettes. Bars represent the proportions of respondents who said they would definitely, probably, probably not, or definitely not want to be told about their genetic risk for the blood clot (black bars) and Alzheimer’s disease (grey bars) vignettes. Figure 2A includes 933 responses to the blood clot vignette and 918 responses to the Alzheimer’s disease vignette from JHS respondents. Figure 2B includes 945 responses to the blood clot vignette and 935 responses to the Alzheimer’s disease vignette from FHS respondents. Figure 2C includes 157 responses to both the blood clot and the Alzheimer’s disease vignette from FHS Omni Cohort respondents.

